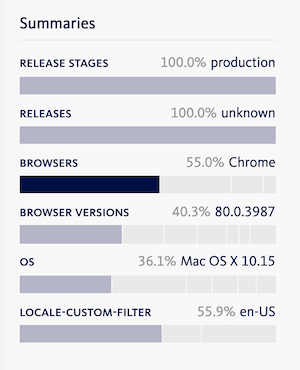
Summary chart
A high level overview of error data.
It’s often useful to be able to see a high level overview of error data. This is provided in the summary chart which is present when viewing the timeline or while viewing a specific error.
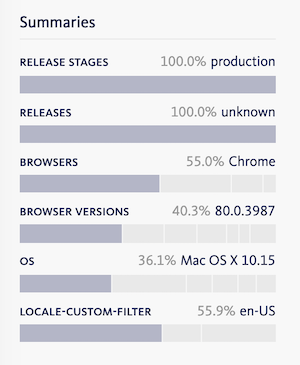
It contains a breakdown of a selection of error properties for the current view. You can select any section of the summary chart to have that applied to the filter bar.
For example, if you click on the O/S section for Mac OS X 10.11 it will apply this filter to the filter bar and update your view to only show errors that occurred under this O/S.