Pivot table
The distribution of values for errors.
The pivot table allows you to see the distribution of values in your error reports. It is present when viewing the timeline or while viewing a specific error.

The example above shows that for the current set of filters, there are 13 different browsers exhibiting this error. Clicking on the Browsers tab will show details of the distribution.
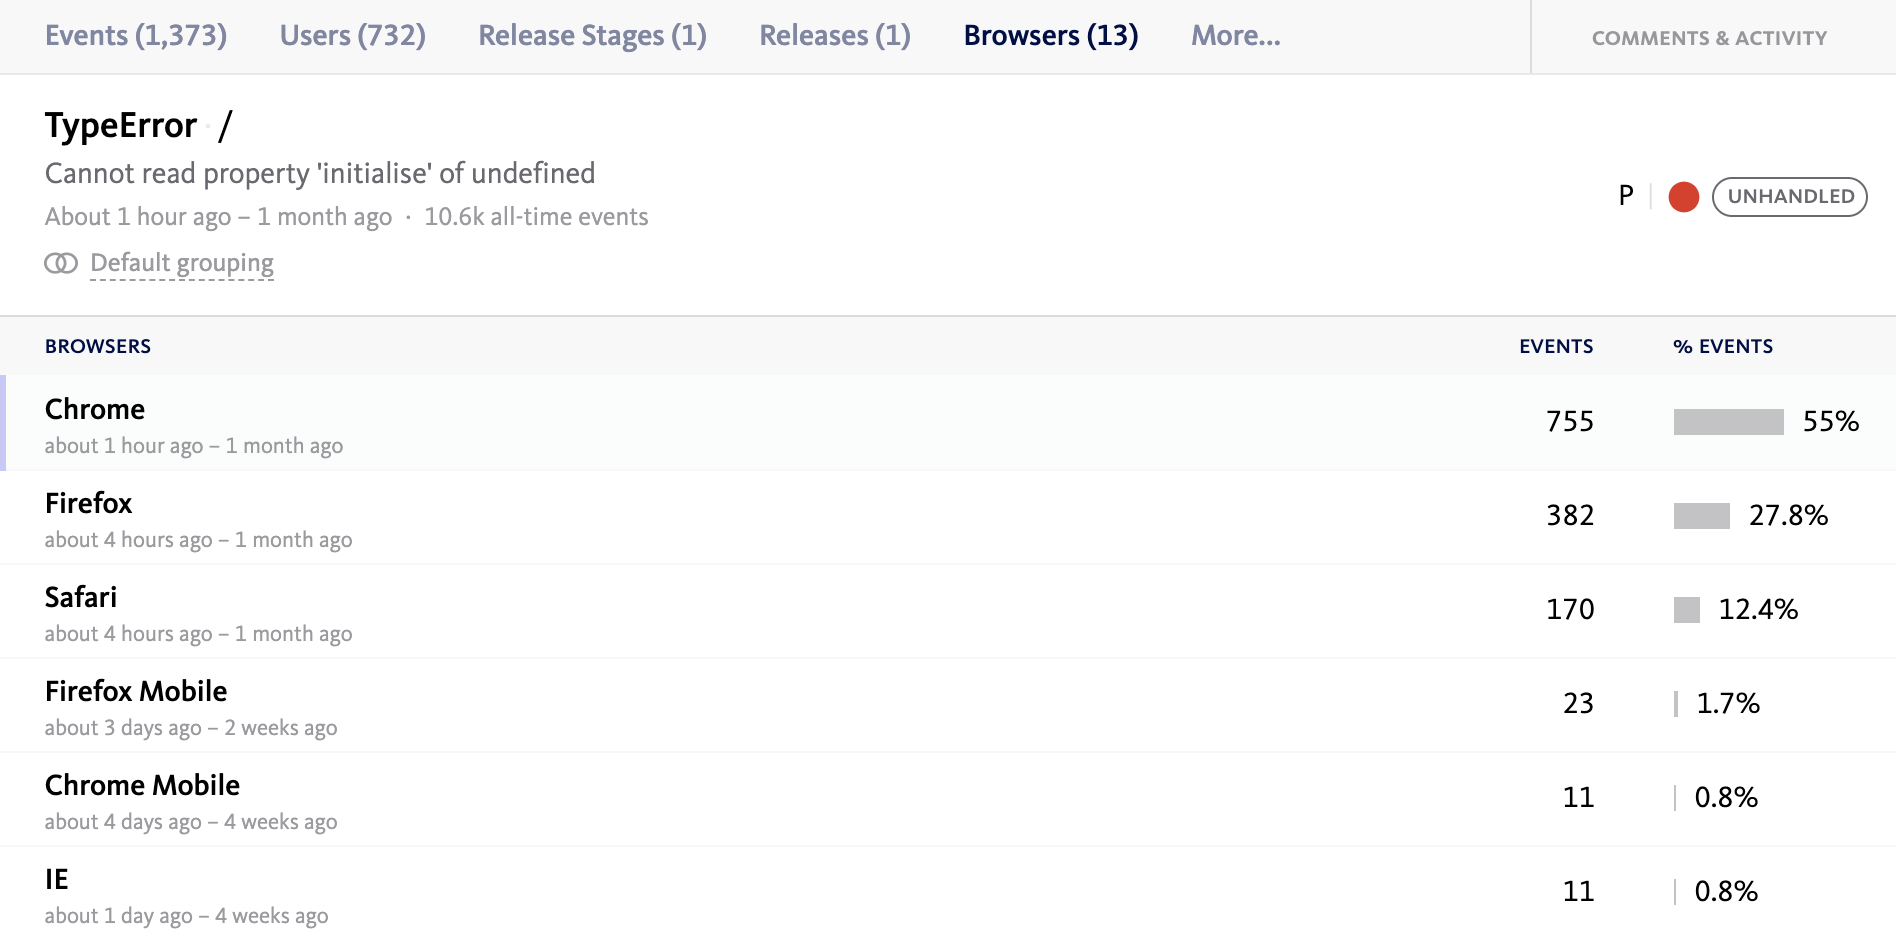
Selecting any of these values in the breakdown will apply this as a filter to the filter bar.