Search & segmentation
Find the errors that matter using the search bar.
The search bar provides a powerful way to find relevant errors in your inbox and timeline, and relevant events of an error on the error details page.
The search bar has the following elements:
- Release stage filter: Show errors from the release stages you care about, such as production.
- Release/version filter: Show errors affecting the important versions of your application.
- Severity filter: Show only the most serious errors that crash your application.
- Search box: Simple and powerful search to target specific errors, for example those occurring in a part of your code, affecting certain users, or anything else.
- Date & time filter: Errors that occurred recently or within specific date ranges.
- Saved filtersets: Save the current filterset to quickly return to it whenever you want.
Release stage
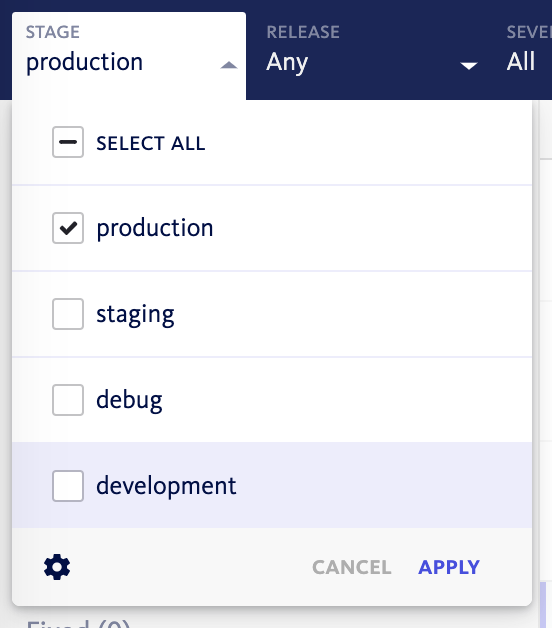
Use the release stage filter to show errors from specified release stages.
A release stage is the environment that your application is running in, such as production, staging or development. Find out more about setting the release stage.
Usage
- Open the release stage filter by clicking it or using the keyboard shortcut
s>s. - Check the release stages you want to see errors from.
- Select Apply.
Examples
- Only show errors that have occurred in your live/release/production environments.
- See errors generated by beta testers.
- Focus on errors that occur in your development environment to speed up development.
In cases where there are hidden release stages and the ‘Select all’ option is checked in the release stage filter, events from hidden release stages will still be shown.
Release/version and feature
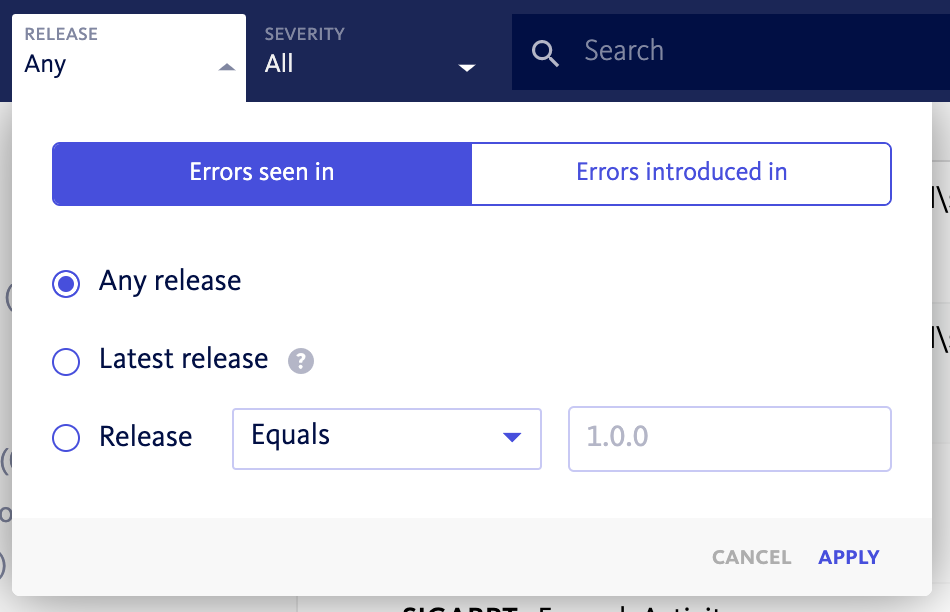
Use the release/version and feature filter to show errors from specified releases/versions or from feature flags or experiment variants.
Releases are generated when BugSnag detects a named version of your application is running in a release stage. Find out more about setting your app version.
Usage
- Open the release/version filter by clicking it or using the keyboard shortcut
s>r. - Select Errors seen in to show all errors that occurred in selected releases, or Errors introduced in to show errors that first occurred in the selected releases.
- Select Latest to show errors from the most recent release only.
- Select specific releases or release ranges by selecting Release and then one of the following options:
- Equals to show individual releases.
- Wildcard matches to show ranges of releases, for example
1.*. - Before or Since to show all releases that were released before or since the specified release, chronologically.
- Select Apply.
Examples
- Show errors from all releases of your current major version.
- Only show errors occurring in your latest version.
- See which errors were introduced in a specific release.
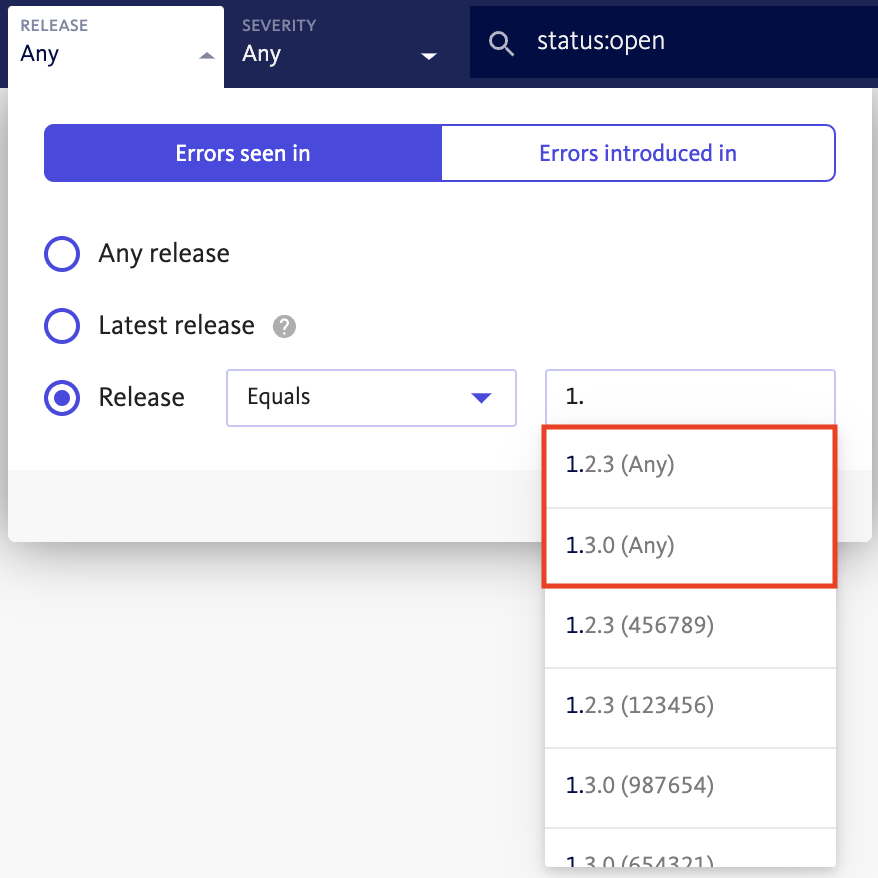
Searching for Any release
For platforms where multiple version numbers are provided such as Android (versionName and versionCode) and iOS (Version and Build), BugSnag provides a mechanism that allows you to search across all releases for a given app version. Look out for (Any) at the end of the release suggestions:
Severity
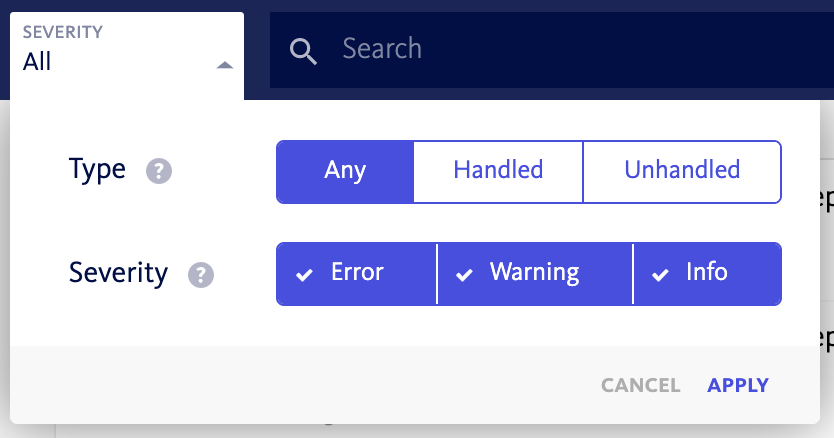
Use the severity filter to show errors that were unhandled by your application code or are of specific severity.
Find out more unhandled errors and severity in the severity indicator docs.
Usage
- Open the severity filter by clicking it or using the keyboard shortcut
s>u. - Select the Type to show only unhandled errors captured by BugSnag, or handled errors reported by your code.
- Select the Severity to show errors of the selected severity level: error, warning or info.
- Select Apply.
Examples
- Focus on the unhandled
errorseverity errors which have the biggest impact on your users.
Search box
Get to the search box quickly using the keyboard shortcut /.
Simple search
Type any string to search across common fields for matching errors.
Try these examples:
BadException– find errors with a type or error class of BadException.MyCodeFile.java– find errors where the stack trace includes stack frames from MyCodeFile.java.mycustomer.com– find errors impacting users with a @mycustomer.com email address.
Search builder
Select Search builder to precisely specify the fields you want to match errors on. The available fields are split into five tabs: Stacktrace, Workflow, User, Environment & Custom Filters. If you want to search on a field that is not available by default you can add a custom filter. See the custom filter docs for details.
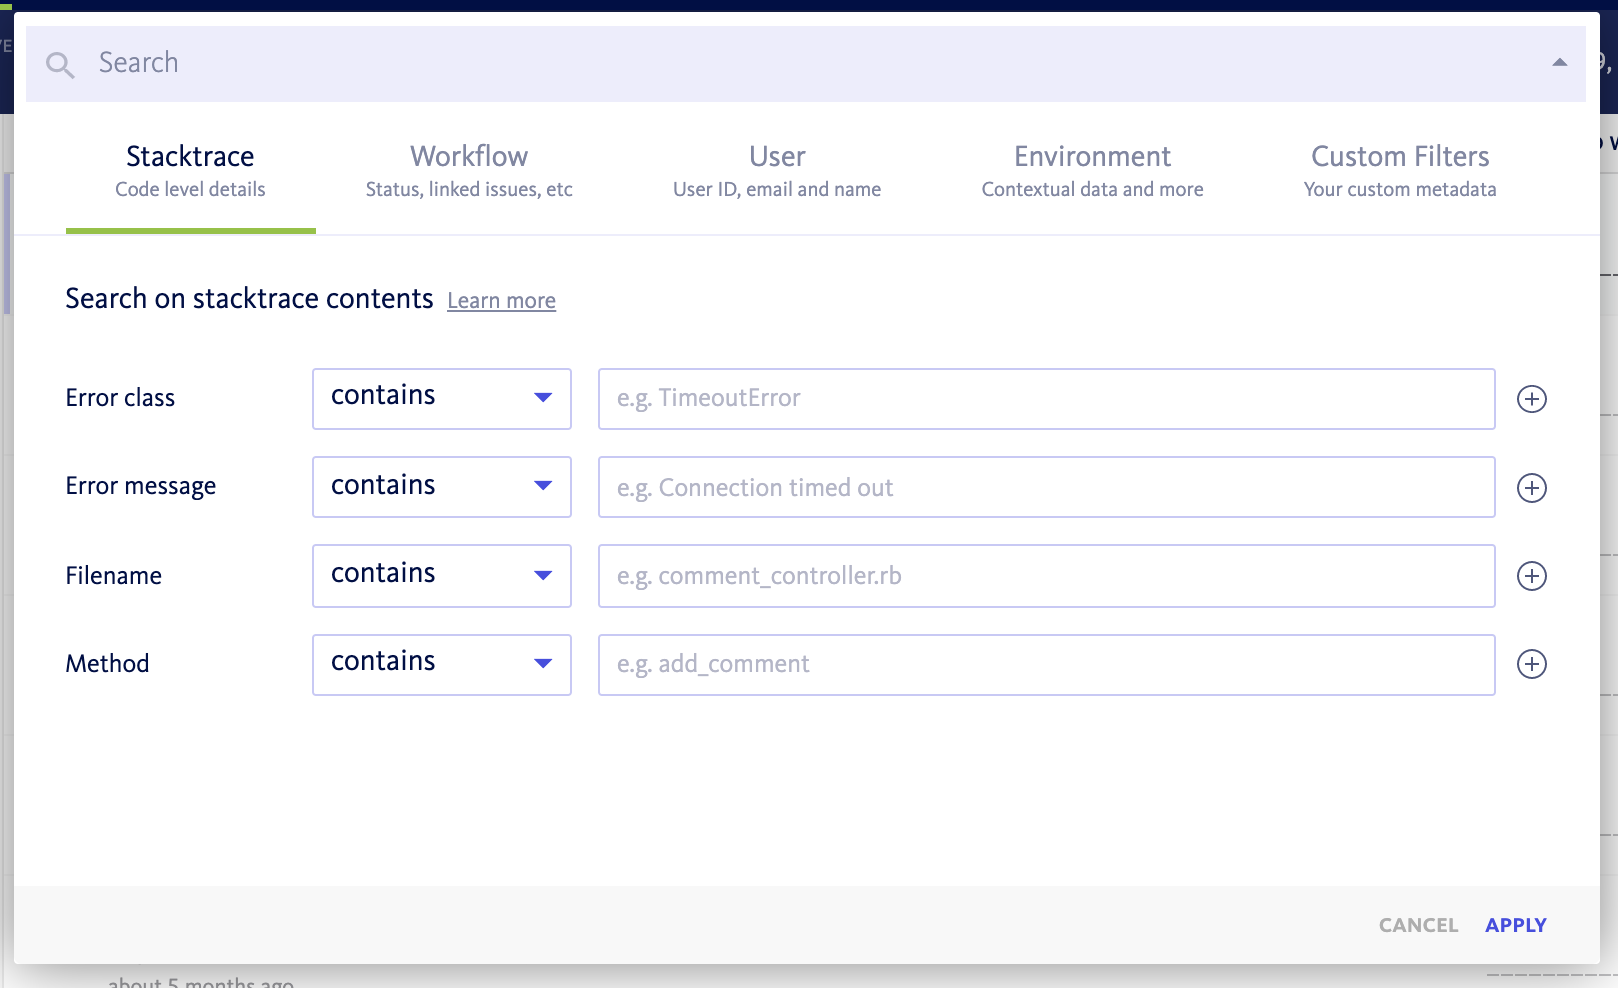
Stacktrace
Search by properties of the code where the error originates, such as the error class, error message or the filenames and methods of the code running at the time of the error.
Workflow
Find errors based on their progress through the BugSnag workflow, including their status and which collaborator they are assigned to.
User
Discover errors affecting certain users of your app, identified by their ID, email or name. See your platform’s docs to add this information to your error reports.
Environment
Search on properties of the environment where your application is running. Depending on the type of your app this could be information about the browser, mobile device or server where the error occurred.
Wildcards are supported when filtering by Browser version or OS version (e.g. 1.*, 1.?.0).
Custom filters
Filter errors by custom fields to analyze problems critical to your business, like bugs seen by key customers, or in A/B tests. See your platform’s docs to find out how you can add custom attributes (metadata) to each error or find out more about custom filters.
Advanced search syntax
Alternatively you can perform advanced searches directly in the search box using the key:value syntax where:
- The field identifier is a camel case representation of the field name, for example
userEmailorerrorClass. - The separator is either a
:to search for matching values, or:!to search for values that do not match. - If the value contains spaces it must be surrounded in double-quotes.
- Use
[empty]in the search box to filter for empty values.
Examples
Try these examples:
userEmail:bugsnag.com– find errors the happened for users with a bugsnag.com email address.errorClass:!Timeout– find all the errors where the error class isn’t a timeout error.myCustomerType:vip– find the errors affecting VIP customers as defined by you and using a custom filter.
Date & time
Use the date & time filter to show recent errors that occurred in the last hour, day, week or month, or choose a specific date range.
Usage
- Select one of the quick filters: 1h, 3h, 1d, 7d or 30d.
- Enter the start and end date to show a specific range. All common formats are accepted, plus free text values like ‘3 days ago’.
Examples
- Select the 1d quick filter to show errors from the most recent 24 hours each time you refresh the dashboard.
- Enter a date range to investigate errors during a known timeframe.
Saving filtersets
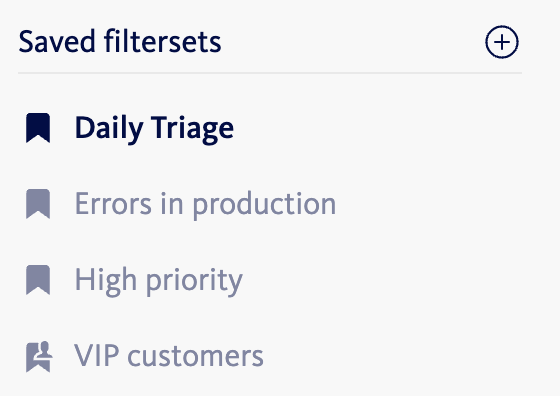
Once you have selected a set of filters and search criteria, together known as a filterset, you can easily save the state of the search bar so that you can access it again at any time. You can create and manage saved filtersets in two places in the dashboard.
- In the Inbox tab, look for the Saved filtersets section in the left side bar.
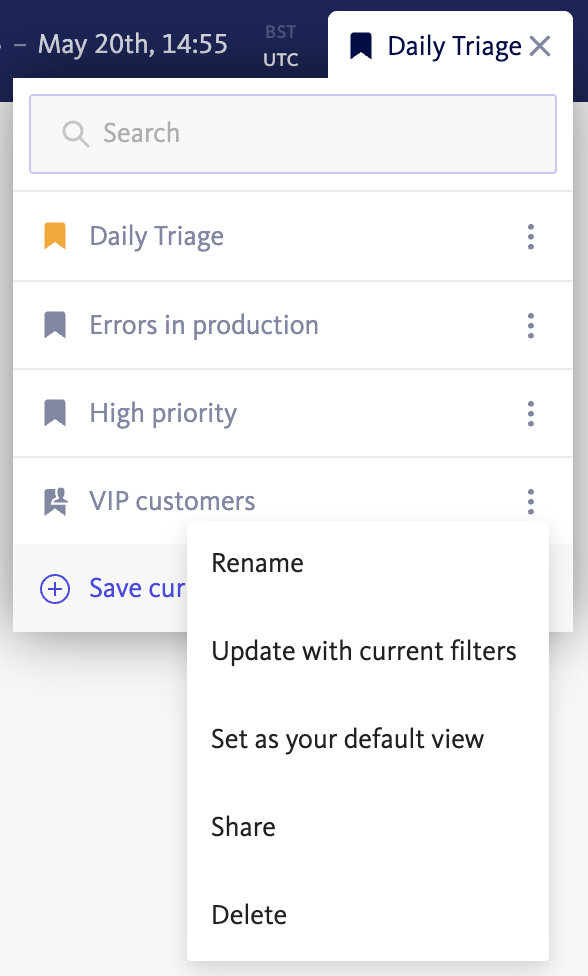
- In the Timeline or Inbox tab, look for the Saved filtersets icon at the right end of the Search Bar.
Select Save current filterset. You can choose a name for the filterset, make it your default for the project or share with your team if desired.
Switch to a different filterset using the same button, or select one from the list displayed.
Options Menu: Select the menu icon for additional options including rename, update, share, set default, and delete.
Sharing filtersets
This is a great way to get your team aligned on which errors to focus on. When you share a saved filterset, all collaborators on your team will be able to view, edit, and delete shared filtersets.
You can create a shared filterset directly or edit one you already use to be shared with your teammates. For new filtersets, select Save current filterset and enable the Share this saved filterset checkbox. To share an existing filterset, click on the context menu for that filterset and select “Share”.
Performance
The BugSnag Performance dashboard is searchable using a slightly different set of filters to those available in the error dashboards.
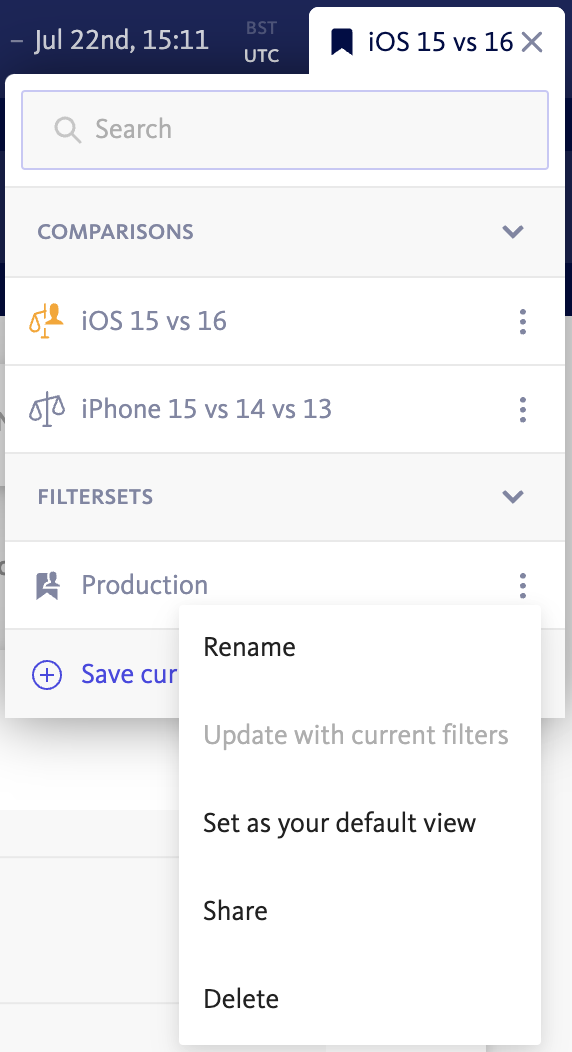
Just like with errors, you can save performance filtersets for quick access later. You can also choose to save performance comparisons.
Both saved performance filtersets and saved performance comparisons can be set as your default Performance dashboard view for a BugSnag project. They can also be shared with other collaborators in your organization, ensuring everybody tracks the areas of your application performance that are most important to your team.
Saved filtersets are not shared across the Error and Performance areas of the product.