Custom filters
Filter error reports using custom error properties.
Custom filters allow you to search for events by custom metadata you’ve added to your error reports. You can also add a pivot and summary when you add a custom filter to see the distribution of data across custom dimensions. This feature is available on our Preferred and Enterprise plans and is available to trial today!
Creating a new custom filter
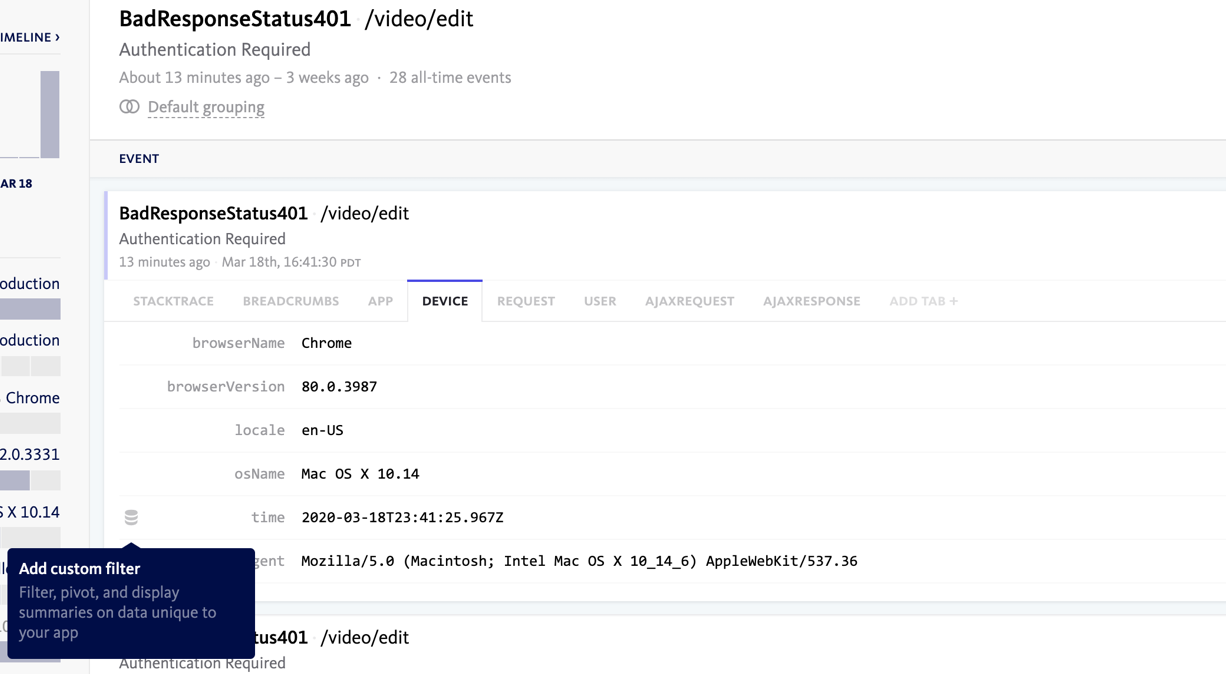
The easiest way to add a new custom filter is from the dashboard.
While viewing an event report, click the Add Custom Filter icon:
Choose a filter display name. This is the name you’ll use to find your custom filter in the filter bar.
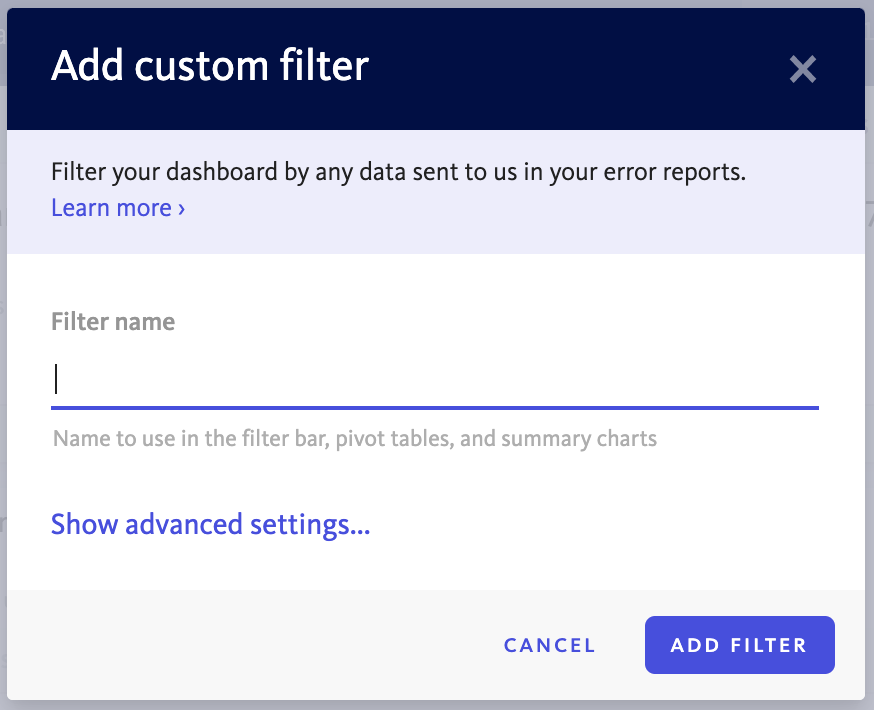
You can also configure additional advanced settings by clicking “Show advanced settings…”
Using custom filters
All custom filters you create will be available from the filter bar. This will allow you to search for events that match specific values of your custom data.
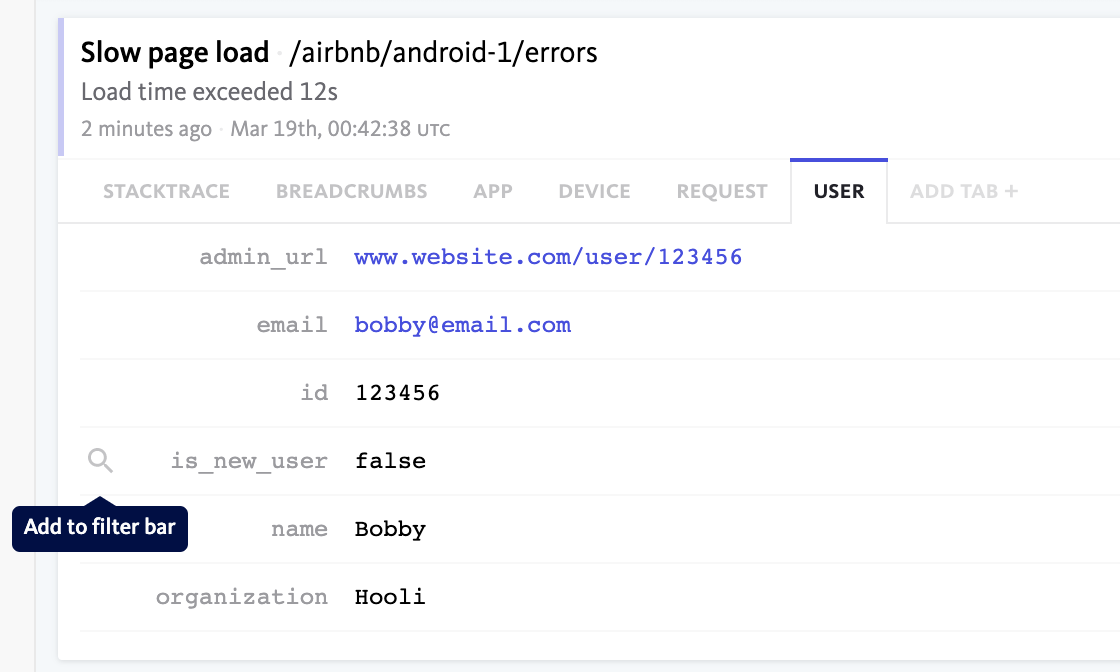
You’ll also see an option to click custom data in your event reports and add it as a filter, if you’ve indexed a top-level key with a value that is a string, number, or boolean:
Custom filter types
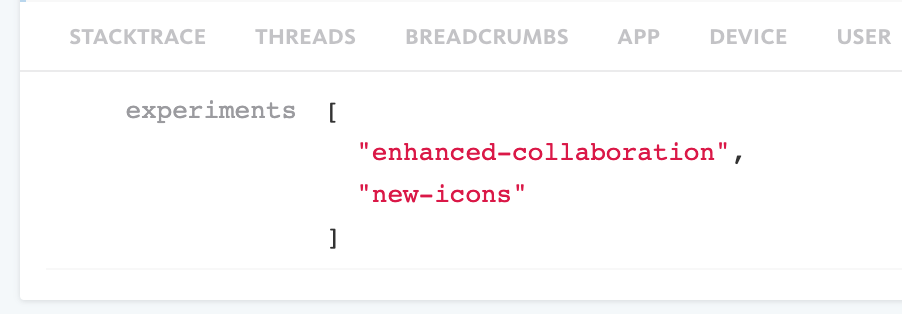
Two types of custom filters are supported: strings and arrays.
Array custom filters should be used where there are multiple values for a key. Once an array custom filter is set up, any new values will be automatically indexed and available for filtering in the BugSnag dashboard.
Managing custom filters
Custom filters can be managed from Project Settings -> Custom filters.
To create a new custom filter, click “Add Custom Filter”. To edit an existing custom filter, click on it in the list view.
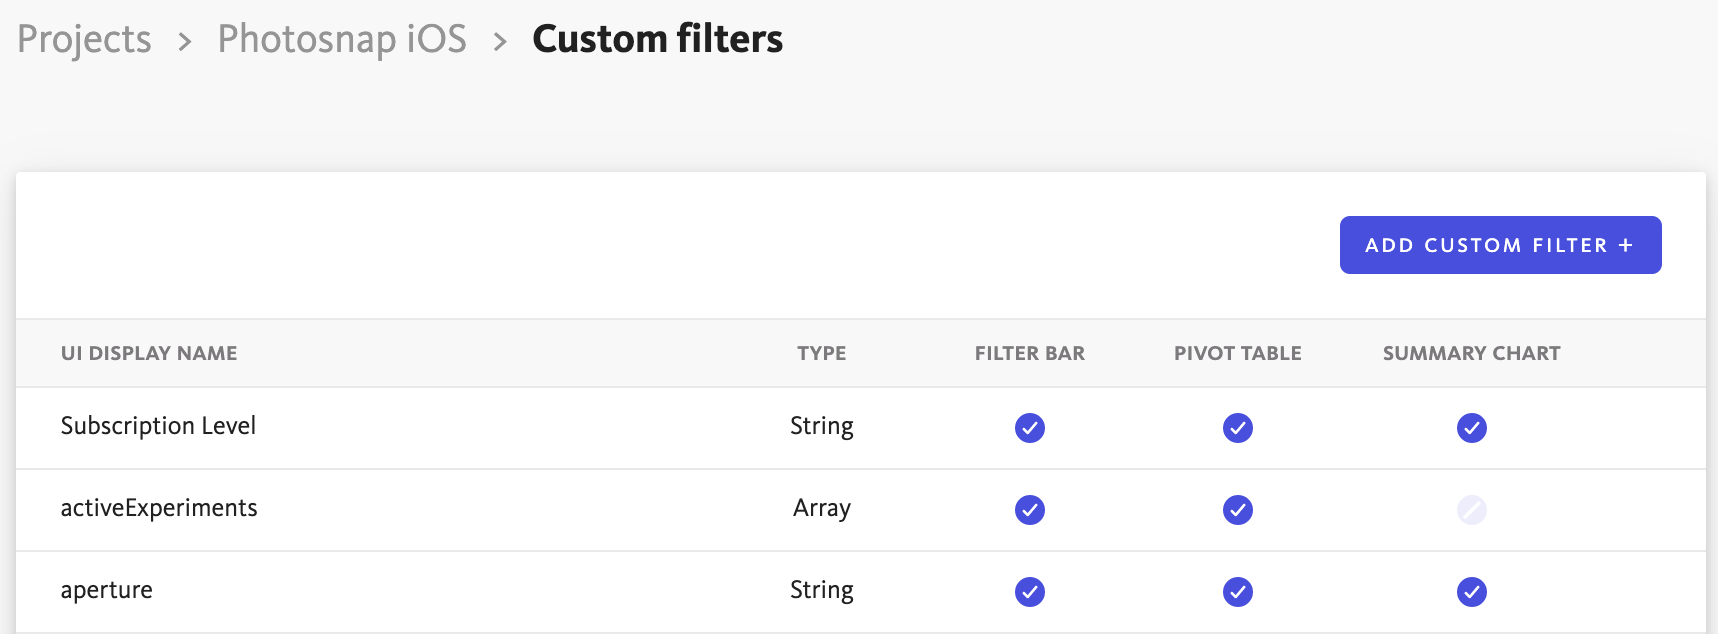
Editing a custom filter provides the following options, you can find out more about these in our advanced custom filters documentation.
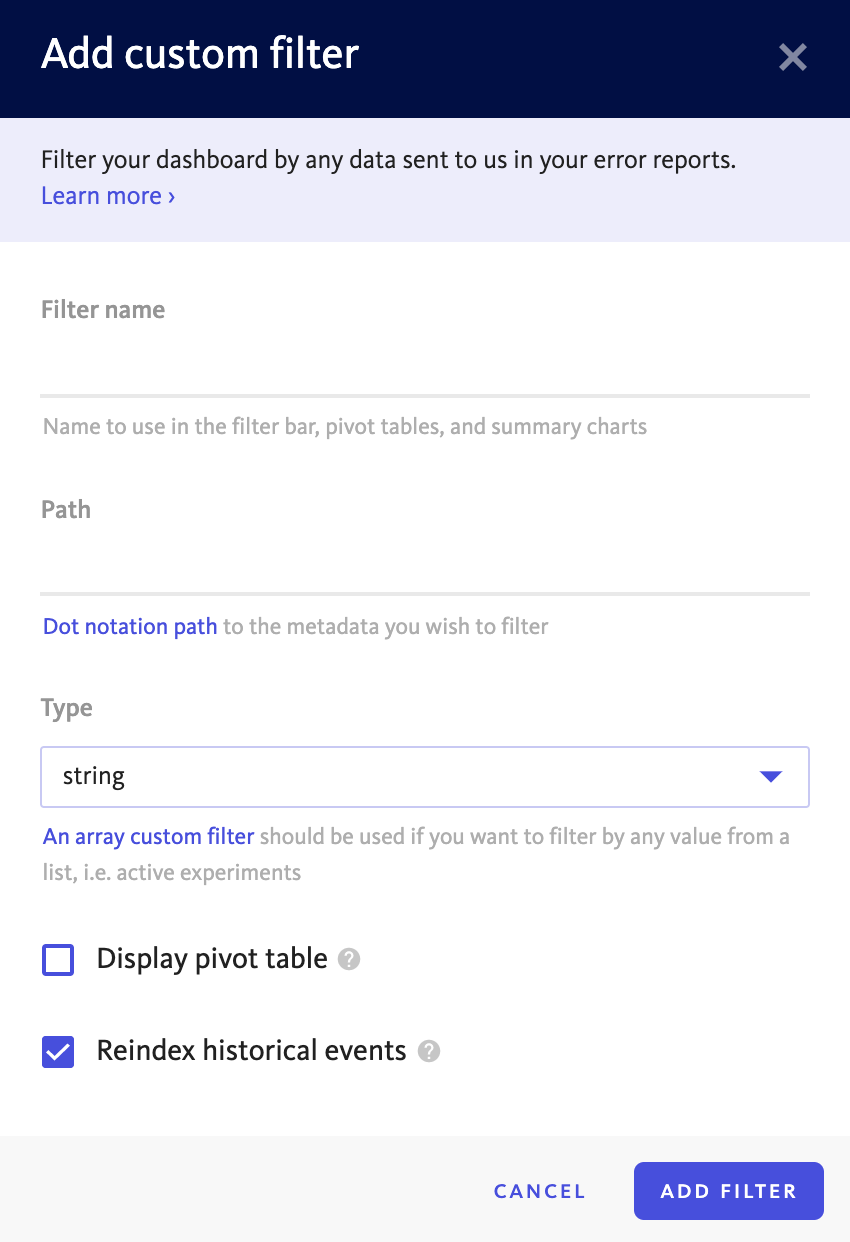
To delete an existing custom filter, click on it in the list view and click “Delete this filter…” in the edit modal.
Exception to these guidelines:
- For structured data in the
Requesttab you can create custom filters for specificheadersorparams. To do so, follow the guidelines above, but substituterequestin place ofmetaData. Some examples:request.headers.Hostrequest.params.controller
Additional Details
- For string custom filters, the first 255 characters will be indexed.
- For array custom filters, the first 100 characters will be indexed for the first 100 array elements.
- Custom filters can only used for exact match filtering, not substring matching.
Please contact us for help configuring custom filter paths.