Monitoring your instance
Monitor your BugSnag On-premise installation.
BugSnag comes supplied with pre-built Grafana dashboards which you can use to monitor the health of your BugSnag instance and set up alerts.
Starting with Grafana
The Grafana dashboards are available at the address specified during installation, you may have to configure DNS routing depending on which cloud provider you are using. The login details are as follows:
- Username: admin
- Password: Retrieved by running:
kubectl -n bugsnag get secret password -o jsonpath="{.data.grafana_admin}" | base64 --decode
Setting up notifications
Alerts
You can receive notifications when your instance is unhealthy, such as disk usage going above 75%, and health checks failing.
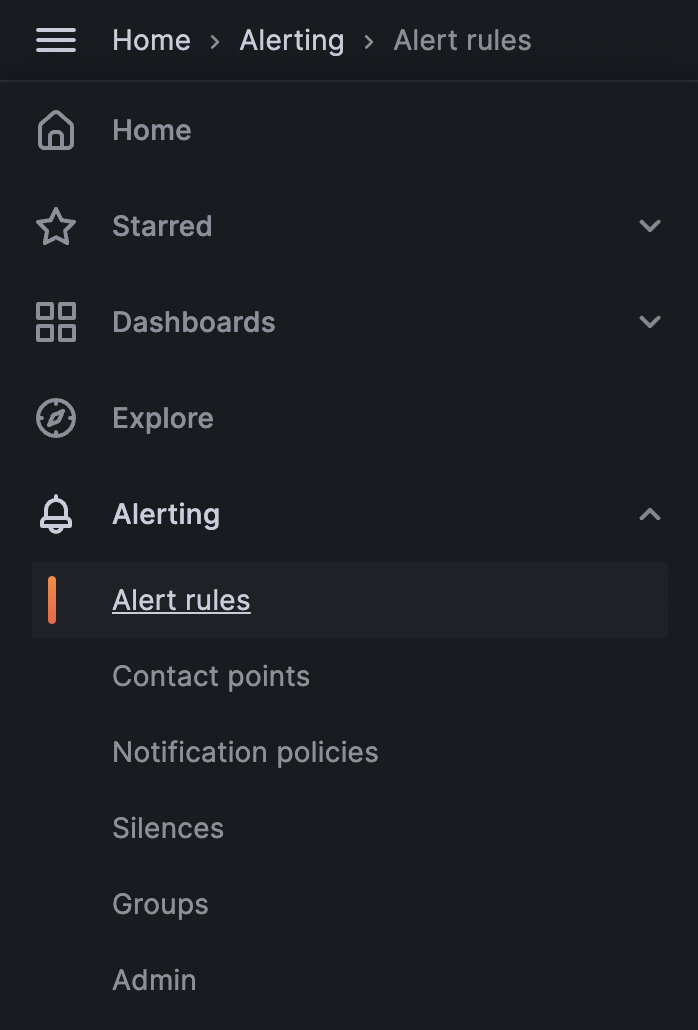
BugSnag should provision a collection of useful alerts by default. Configured alerts can be viewed by navigating to ‘Alerting → Alert rules’.
Contact Points
You will need to set up contact points for your alerts to be sent to.
The grafana-default-email will by default be set to example@email.com, and will need to be changed to a real email as this contact point is used by all alerts.
Notification Policies
You will need to set up notification policies for deciding which contact points your alerts are sent to.