Performance targets
Define thresholds for your application’s performance, to ensure your users are getting the best possible experience.
Performance Targets allow you to set thresholds in BugSnag to compare the performance of different parts of your application. BugSnag supports tiered thresholds, which allows you to configure a different target for warning and critical levels. Default targets are set for similar areas of your application – for example network requests or mobile screen loads – and can be customized for individual span groups, giving you fine-grained control of your target application performance.
Default targets
Each span category in BugSnag – for example network requests, mobile screen loads, or web page loads – can have a default Performance Target configured. A default target must be set before you can customize it for individual span groups.
To configure default targets, look out for the ‘Set targets’ chips in the Performance dashboard, or navigate to Project settings > Performance > Performance targets. Targets are configured in milliseconds.
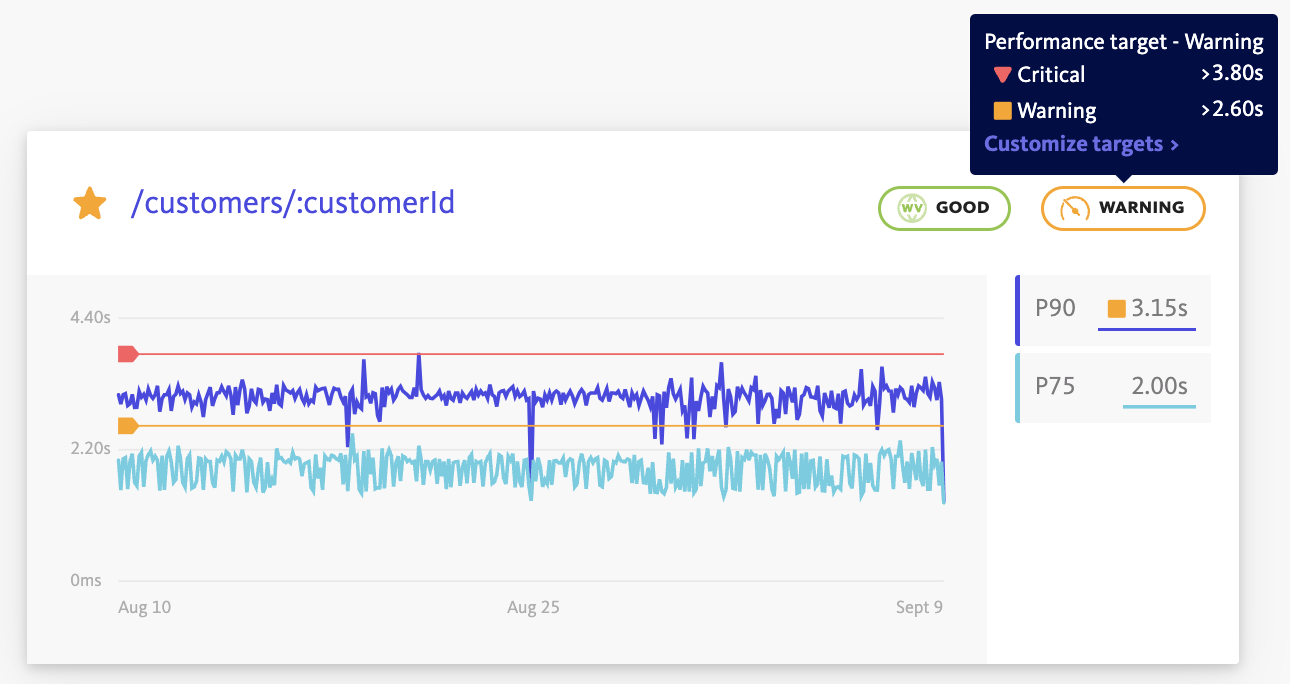
Once targets have been configured, you will see indicators as you navigate the BugSnag Performance dashboard to let you know how the performance for your current set of filters compare to the targets you have defined.

Custom targets
Once you have configured default targets, you can set custom targets for individual span groups. Custom targets enable you to fine tune your application’s Performance Targets as you get a better understanding of its behavior and what matters most to your users.
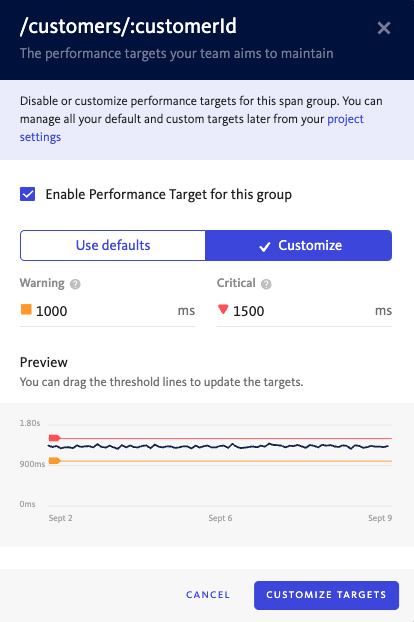
To set a custom target, look out for a Performance Target indicator, hover over it and click ‘Customize targets’. Set a custom target for this span group by selecting the ‘Customize’ tab. You can either input your targets directly, or drag the target lines on the graph at the bottom of the screen.

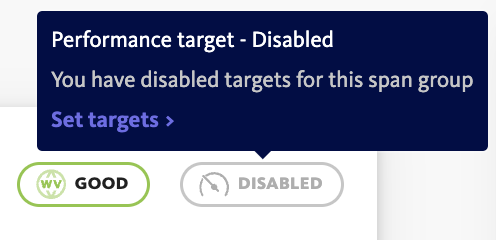
You can also choose to disable targets for individual span groups. This will hide all the performance indicators for that span group from the dashboard:

Recommendations
BugSnag provides a quick start performance target configuration for App Starts based on recommendations from Apple and Google. Look out for the banner at the top of your App Starts Performance dashboard:

After clicking ‘Use recommendations’ BugSnag will automatically populate the Performance Targets for your App Starts. These are:
- iOS:
- App starts faster than 400 milliseconds
- Android
- Cold startups faster than 5 seconds
- Warm startups faster than 2 seconds
- Hot startups faster than 1.5 seconds
Support for real-time alerts for your application’s performance are coming to BugSnag soon. You will be able to configure alerts to notify you when your application’s performance drops below your Performance Target thresholds.