Flutter performance integration guide
Step-by-step instructions for adding performance monitoring to your Flutter applications for Android and iOS.
The BugSnag Performance Flutter integration automatically instruments your app’s start time and, by using our simple wrapper packages, will instrument navigation events and network requests. Arbitrary operations can also be manually instrumented in your code.
New to BugSnag? Create an account
Looking for error monitoring? See our integration guide
Installation
Add bugsnag_flutter_performance to your application with the flutter command line tool:
$ flutter pub add bugsnag_flutter_performance
You can also manually add bugsnag_flutter_performance to your pubspec.yaml:
  dependencies:
    bugsnag_flutter_performance: ^2.0.0
The latest available version of bugsnag_flutter_performance is v2.1.1.
Compatibility
The BugSnag Flutter Performance SDK is compatible with v3.10+ of the Dart SDK.
Basic configuration
To configure the bugsnag_flutter_performance package, call bugsnag_performance.start as early as possible in your main method and wrap your runApp call as follows:
import 'package:bugsnag_flutter_performance/bugsnag_flutter_performance.dart';

Future<void> main() async {
  await bugsnag_performance.start(
    apiKey: 'YOUR_API_KEY_HERE'
  );
  bugsnag_performance.measureRunApp(
    () async => runApp(const MainApp())
  );
}
This is the same API key used by the BugSnag Error Monitoring library.
You can find your API key in your project’s settings (shortcut: gs) in the dashboard.
Instrumenting app starts
With measureRunApp wrapping your runApp call, as described above, the BugSnag Performance SDK will measure the startup time of your app. This is recorded from the point at which bugsnag_performance.start is called until the first frame is rendered. These timings are shown under the “App starts” tab in the BugSnag Performance dashboard.
App start types
You can also categorize your app starts into separate types of launches on your dashboard. For example, you may wish to see app start data for first-time and logged-in users separately on your dashboard.
To set the app start type, use the following API before the app start is complete:
final control = bugsnag_performance.getSpanControl<AppStartSpanControl>();
control?.setType('FirstOpen');
Instrumenting navigation
By instrumenting the views in your app, the timings for app navigation events can be shown on the BugSnag Performance dashboard.
Automatic instrumentation
If you use the Navigator widget or any solution compatible with NavigatorObservers, such as go_router, these navigation events can be automatically measured using our BugsnagPerformanceNavigatorObserver.
MaterialApp with Navigator
To track navigation events, pass the BugSnag observer in when you create the MaterialApp widget:
@override
Widget build(BuildContext context) {
  return MaterialApp(
    // ...
    navigatorObservers: [BugsnagPerformanceNavigatorObserver()],
    // ...
  );
}
Nested navigators
To track navigation events on nested navigators, wrap your Navigator with a BugsnagNavigationContainer and pass in a named BugSnag observer:
BugsnagNavigationContainer(
  child: Navigator(
    observers: [BugsnagPerformanceNavigatorObserver(navigatorName: 'MyNestedNavigator')],
  ),
)
go router
If your app uses the go_router package, pass in a BugSnag observer when you create GoRouter:
final GoRouter _router = GoRouter(
  routes: <RouteBase>[
    /* Your routes */
  ],
  observers: [BugsnagPerformanceNavigatorObserver()],
);
Defer ending navigation spans
By default, navigation spans will end as soon as the first frame displaying the content of the route is rendered. However sometimes the app is not yet ready for use, for example because more data needs to be loaded first.
Use the BugsnagLoadingIndicator widget to let the navigation instrumentation know that the content is still being loaded: the navigation span will not end while any BugsnagLoadingIndicator widgets exist in the view:
@override
Widget build(BuildContext context) {
  final data = _data;
  return Column(
    children: [
      if (data == null) const BugsnagLoadingIndicator(),
      HeaderWidget(),
      ContentWidget(data: data),
    ],
  );
}
The indicator widget itself has no appearance, but you can wrap any loading widgets – such as spinners – with a BugsnagLoadingIndicator by providing it as the child argument:
@override
Widget build(BuildContext context) {
  final data = _data;
  if (data == null) {
    return const BugsnagLoadingIndicator(child: Text('Loading...'));
  }
  return ContentWidget(data: data);
}
Manual instrumentation
To instrument navigation events manually, call startNavigationSpan when a navigation is started and end on the resulting span when the navigation is complete:
final span = bugsnag_performance.startNavigationSpan('HomeScreen')

// When the screen has finished rendering:
span.end()
Instrumenting view loads
In addition to navigation measurements, you can capture the loading time of individual Widgets by wrapping them in a MeasuredWidget:
@override
Widget build(BuildContext context) {
  return MeasuredWidget(
    name: 'HomeScreen',
    builder: (context) {
      return HomeScreenWidget();
    },
  );
}
Instrumenting network requests
Automatic instrumentation
The BugSnag Flutter Performance SDK contains packages to detect and report network requests from the http, dart:io and dio libraries. These timings are shown under the “Network requests” tab in the BugSnag Performance dashboard.
http package
To instrument network requests made with the http package, add the bugsnag_http_client package to your application:
$ flutter pub add bugsnag_http_client
As part of your app initialization, add bugsnag_performance as a subscriber.
In your application code, use package:bugsnag_http_client instead of package:http. bugsnag_http_client wraps http, maintaining an identical interface, so you can make network requests through either the top-level functions or a Client:
import 'package:bugsnag_http_client/bugsnag_http_client.dart' as http;

// add subscriber(s) as part of app initialization
http.addSubscriber(bugsnag_performance.networkInstrumentation);
http.addSubscriber(bugsnag.networkInstrumentation);

// use http; requests will be instrumented by BugSnag
http.get('https://example.com/api');
If you are using the BugSnag Flutter Error SDK, you will need to ensure you are using v3.1.0+ with the same bugsnag_http_client package, then register bugsnag as a subscriber in order to also capture network breadcrumbs in your BugSnag error events.
dart:io package
To instrument network requests made with dart:io, add the bugsnag_flutter_dart_io_http_client package to your application:
$ flutter pub add bugsnag_flutter_dart_io_http_client
As part of your app initialization, add bugsnag_performance as a subscriber.
In your application code, use package:bugsnag_flutter_dart_io_http_client instead of package:dart_io. bugsnag_flutter_dart_io_http_client wraps dart_io, maintaining an identical interface, so you can make network requests by creating a client Client:
import 'package:bugsnag_flutter_dart_io_http_client/bugsnag_flutter_dart_io_http_client.dart'
    as dart_io;

// add subscriber(s) as part of app initialization
dartIo.addSubscriber(bugsnag.networkInstrumentation);
dartIo.addSubscriber(bugsnag_performance.networkInstrumentation);

// use dart_io; requests will be instrumented by BugSnag
final client = dartIo.HttpClient();
final request = await client.getUrl('https://example.com/api');
If you are using the BugSnag Flutter Error SDK, you will need to ensure you are using v3.1.0+ with the same bugsnag_flutter_dart_io_http_client package, then register bugsnag as a subscriber in order to also capture network breadcrumbs in your BugSnag error events.
dio package
dio uses dart:io by default. dio allows you to specify an alternative client adapter, so you can instrument the network requests by using bugsnag_flutter_dart_io_http_client, the BugSnag dart:io wrapper (as described above).
Add bugsnag_flutter_dart_io_http_client to your application:
$ flutter pub add bugsnag_flutter_dart_io_http_client
Then add the BugSnag Performance and BugSnag (for breadcrumbs) subscribers to bugsnag_flutter_dart_io_http_client as part of app initialization. When you instantiate Dio, replace its httpClientAdapter:
import 'package:dio/dio.dart';
import 'package:bugsnag_flutter_dart_io_http_client/bugsnag_flutter_dart_io_http_client.dart'
    as dart_io;

// add subscriber(s) as part of app initialization
dart_io.addSubscriber(bugsnag.networkInstrumentation);
dart_io.addSubscriber(bugsnag_performance.networkInstrumentation);

// replace dio's http client adapter
final dio = Dio();
if (!kIsWeb) {
  dio.httpClientAdapter = IOHttpClientAdapter(
    createHttpClient: () {
      return dart_io.HttpClient();
    },
  );
}

// use dio; requests will be instrumented by BugSnag
dio.get('https://example.com/api');
The networkRequestCallback configuration option allows you to control the data sent in these network request spans using a callback.
Manual instrumentation
To instrument network requests manually, call startNetworkRequestSpan when a navigation is started and end on the resulting span when the navigation is complete:
final span = bugsnag_performance.startNetworkSpan('https://example.com/api', 'GET');

// When the network request has completed:
span.end()
Sending custom spans
To send custom spans to BugSnag for any other operations you wish to measure, use bugsnag_performance.startSpan to start a span, and call the span’s end method to end the measurement:
final span = bugsnag_performance.startSpan('Login');
await LoginApi.login();
span.end();
Reporting child-only spans
If a custom span is “first class”, its performance characteristics will be aggregated and shown in the “Custom” tab of the BugSnag dashboard. If the custom span is useful only for adding insight into the performance of its parent (through the waterfall diagram on the span instance page), you should set the isFirstClass span option to false:
final span = bugsnag_performance.startSpan('always-nested', isFirstClass: false);
Controlling span hierarchies
When viewing a single instance of a span in the BugSnag dashboard, a waterfall diagram will show you that instance’s children and their children, and so on. This allows you to see in more detail where the time was spent, and aid diagnosing and fixing any problems. When creating your own spans, you can use the options parameter to control their parent-child relationships to produce a meaningfully representative hierarchy in your dashboard. See Maintaining span context for more information.
Start time override
By default, a span will use the current timestamp as its start time. However, you can use the startTime span option to report spans that have already started by providing your own timestamp. You can also end a span with your own timestamp to provide a retrospective end time:
final taskStartTime = DateTime.now();

// When the task has completed:
final taskEndTime = DateTime.now();

bugsnag_performance.startSpan('custom-start-time', startTime: taskStartTime).end(endTime: taskEndTime);
Adding custom span attributes
Additional data can be added to spans to help diagnose performance issues. These are sent as span attributes and will be displayed on your Performance dashboard alongside the automatic span data captured by the SDK.
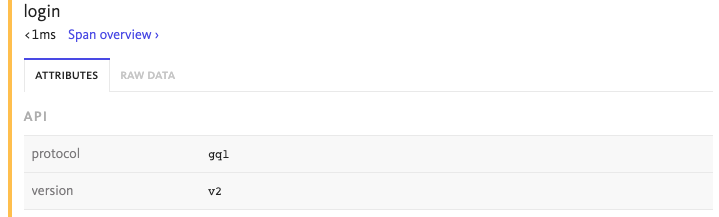
Attributes are added via a span object and are name value pairs where the type can be either a string, integer, double, boolean or an array of one of these types:
final span = bugsnag_performance.startSpan('span-with-data');
span.setAttribute('api.protocol', 'gql');
span.setAttribute('api.version', 'v2');
span.end();
You can use a callback to set attributes when they are ending. This allows you to access all spans being generated, including those from automatic instrumentation:
await bugsnag_performance.start(
  apiKey: apiKey,
  onSpanEndCallbacks: [
    (span) async {
      span.setAttribute('device.locale', 'en-US');
      return true;
    }
  ],
);
The number and size of attributes added to spans are limited by the SDK to avoid oversized span payloads that would be rejected by the BugSnag API. See the Custom attribute limit configuration options to see how this can be customized if more data is required.
These callbacks can be executed with a high frequency, so care should be taken not to perform complex operations that will have a detrimental effect on performance. For more information, see the span callbacks configuration option.
Capturing system metrics
Monitoring key system metrics such as frame rendering durations, CPU usage and memory consumption is essential for maintaining a good user experience in your application. By continuously monitoring these metrics, you can detect performance issues early and prevent further slowdowns or crashes that would have an even bigger impact on your end user experience.
Use the enabledMetrics configuration option to start capturing these metrics in your custom spans:
await bugsnag_performance.start(
  apiKey: 'your-api-key',
  enabledMetrics: const EnabledMetrics(
    rendering: true,
    cpu: true,
    memory: true,
  ),
);
All metrics are disabled by default - enable only what you need.
Per-span overrides
You can also enable or disable metrics on a per-span basis, independently of the global config:
// Enable all metrics for this span (works even if global metrics are off)
final span = bugsnag_performance.startSpan(
  'my-span',
  options: const SpanOptions().withMetrics(),
);
await Future.delayed(const Duration(seconds: 4));
span.end();

// Enable only CPU for this span
options: const SpanOptions().withMetrics(const SpanMetrics(cpu: true))

// Disable all metrics for this span
options: const SpanOptions().withMetrics(SpanMetrics.none())
Per-span overrides take priority over the global config. Unset flags fall back to the global value.
For more information about this feature, please see our System metrics guide.