Unity performance integration guide
Step-by-step instructions for adding performance monitoring to your Unity projects.
The BugSnag Performance Unity integration automatically instruments Unity framework startups. Using our simple wrapper classes will instrument scene loads and network requests. Arbitrary operations can also be manually instrumented in your code.
New to BugSnag? Create an account
Looking for error monitoring? See our integration guide
Installation
To install the BugsnagPerformance SDK through the Unity Package Manager, go to Window → Package Manager and add the package from the following git URL:
https://github.com/bugsnag/bugsnag-unity-performance-upm.git
This will fetch the latest release available when the URL is added. To get a newer version in future builds, re-add the package. You can also specify an exact version using the git tag for the release after the URL:
https://github.com/bugsnag/bugsnag-unity-performance-upm.git#v1.11.0
The latest available version of bugsnag-unity-performance-upm is v1.11.0.
Basic configuration
BugSnag will start automatically in your app once you have configured your API key through Window → Bugsnag → Performance Configuration:

If you are using the BugSnag Error Monitoring SDK, the API key and other common configuration options can either be shared or set separately.
You can find your API key in your project’s settings (shortcut: gs) in the dashboard.
Starting BugSnag manually
If you’d like control over when BugSnag starts, uncheck “Start Automatically” in the Bugsnag Performance Configuration window. Then create a PerformanceConfiguration object, initialized from the Unity Editor, which can then be overridden in code:
var config = BugsnagPerformanceSettingsObject.LoadConfiguration();
config.ReleaseStage = "Production";
BugsnagPerformance.Start(config);
BugsnagPerformance.Start must be called from the main thread – e.g. from the Start lifecycle function of a MonoBehaviour.
If you’d like to configure BugSnag further, check out the Configuration options reference.
Instrumenting app starts
BugSnag will automatically and detect the time it takes to start your game within the Unity framework. These timings are shown under the “App starts” tab in the BugSnag Performance dashboard.
By default we will measure the time it takes to start your game within the Unity framework: that is from the moment the SubSystemRegistration event is triggered until the AfterSceneLoad event is triggered.
To disable automatic instrumentation of app starts, or to control the point at which your app should be defined as started, see the AutoInstrumentAppStart configuration option.
App start types
You can also categorize your app starts to separate different types of launches on your dashboard. For example, you may wish to see app start data for first-time and logged-in users separately on your dashboard.
To set the app start type, use the following code during the app start period:
BugsnagPerformance.GetSpanControl(SpanType.AppStart)?.SetType("logged-in-user");
Be aware that if the app start is already marked as completed then you will not be able to set the type. For manual control over the point at which your app should be defined as started, see the AutoInstrumentAppStart configuration option.
Instrumenting scene loads
Automatic instrumentation
The BugSnag Performance SDK contains a wrapper of the Unity SceneManager class, named BugsnagSceneManager, that will capture the start and end of your scenes. These timings are shown under the “Scene loads” tab in the BugSnag Performance dashboard.
Simply use BugsnagSceneManager instead of SceneManager in your code:
BugsnagSceneManager.LoadScene("MyScene");
Manual instrumentation
If you do not want to use the BugsnagSceneManager wrapper, you can manually report scene load spans instead:
var sceneLoadSpan = BugsnagPerformance.StartSceneSpan(sceneName);

// When the scene has loaded:
sceneLoadSpan.End();
If your apps use your own “Level” abstraction instead of, or as well as, scenes, you are free to instrument them as scenes so that they appear under the “Scenes” tab in the BugSnag dashboard.
Instrumenting network requests
Automatic instrumentation
The BugSnag Performance SDK contains a wrapper of the Unity UnityWebRequest class, named BugsnagUnityWebRequest, that will capture the start and end of network requests made through it. These timings are shown under the “Network requests” tab in the BugSnag Performance dashboard.
Simply use BugsnagUnityWebRequest instead of UnityWebRequest in your code:
var request = BugsnagUnityWebRequest.Get("https://example.com/api");
request.SendWebRequest();
Manual instrumentation
If you do not want to use the BugsnagUnityWebRequest wrapper, you can manually track network requests instead:
var networkSpan = BugsnagPerformance.StartNetworkSpan(url, verb);

// When the network request has completed:
networkSpan.EndNetworkSpan(statusCode,requestContentLength,responseContentLength);
Sending custom spans
To send custom spans to BugSnag for any other operations you wish to measure, use BugsnagPerformance.StartSpan to start a span, and call the span’s End method to end the measurement:
var span = BugsnagPerformance.StartSpan("login");
LoginApi.login();
span.End();
The spanOptions parameter allows you to customize some elements of the span’s behavior:
Reporting child-only spans
If a custom span is “first class”, its performance characteristics will be aggregated and shown in the “Custom” tab of the BugSnag dashboard. If the custom span is useful only for adding insight into the performance of its parent (through the waterfall diagram on the span instance page), you should set the IsFirstClass span option to false:
BugsnagPerformance.StartSpan("always-nested", new SpanOptions { IsFirstClass = false });
Controlling span hierarchies
When viewing a single instance of a span in the BugSnag dashboard, a waterfall diagram will show you that instance’s children and their children, and so on. This allows you to see in more detail where the time was spent, and aid diagnosing and fixing any problems. When creating your own spans, you can use the spanOptions parameter to control their parent-child relationships to produce a meaningfully representative hierarchy in your dashboard. See Maintaining span context for more information.
Start and end time overrides
By default, a span will use the current timestamp as its start time. However, you can use the StartTime span option to report spans that have already started by providing your own DateTimeOffset. You can also end a span with your own timestamp to provide a retrospective end time:
var assetLoadStartTime = DateTimeOffset.UtcNow;

// When the asset has loaded:
var assetLoadEndTime = DateTimeOffset.UtcNow;

BugsnagPerformance
    .StartSpan("my-asset-load-time", new SpanOptions { StartTime = assetLoadStartTime })
    .End(assetLoadEndTime);
Adding custom span attributes
Additional data can be added to spans to help diagnose performance issues. These are sent as span attributes and will be displayed on your Performance dashboard alongside the automatic span data captured by the SDK.
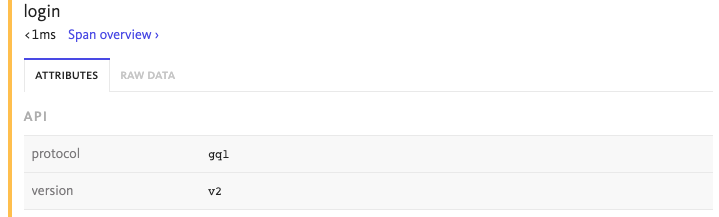
Attributes are added via a span object and are name value pairs where the type can be either a string, integer, double, boolean or an array of one of these types:
var span = BugsnagPerformance.StartSpan("span-with-data");
span.SetAttribute("api.protocol", "gql");
span.SetAttribute("api.version", "v2");
You can use a callback to set attributes when they are ending. This allows you to access all spans being generated, including those from automatic instrumentation:
var config = BugsnagPerformanceSettingsObject.LoadConfiguration();
config.AddOnSpanEnd(@span => {
    @span.SetAttribute("device.locale", "en-US");
    return true;
});
BugsnagPerformance.Start(config);
The number and size of attributes added to spans are limited by the SDK to avoid oversized span payloads that would be rejected by the BugSnag API. See the Custom attribute limit configuration options to see how this can be customized if more data is required.
These callbacks can be executed with a high frequency, so care should be taken not to perform complex operations that will have a detrimental effect on performance. For more information, see the span callbacks configuration option.
Capturing system metrics
Monitoring key system metrics such as frame rendering durations, CPU usage and memory consumption is essential for maintaining a good user experience in your application. By continuously monitoring these metrics, you can detect performance issues early and prevent further slowdowns or crashes that would have an even bigger impact on your end user experience.
Use the EnabledMetrics configuration option to start capturing these metrics in your custom spans:
var config = BugsnagPerformanceSettingsObject.LoadConfiguration();
config.EnabledMetrics = new EnabledMetrics
{
    CPU = true,
    Memory = true,
    Rendering = true
};
BugsnagPerformance.Start(config);
For more information about this feature, please see our System metrics guide.