iOS performance integration guide
Step-by-step instructions for adding performance monitoring to your iOS projects.
The BugSnag Performance iOS integration automatically instruments app starts, UIKit screen loads and network requests. SwiftUI view loads and arbitrary operations can also be manually instrumented in your code.
New to BugSnag? Create an account
Looking for error monitoring? See our integration guide
Installation
Using CocoaPods
Add the BugsnagPerformance pod to your Podfile:
pod 'BugsnagPerformance'
Run pod install after updating your Podfile.
Using Swift Package Manager
Open your Xcode project and select File → Add Packages…
Search for https://github.com/bugsnag/bugsnag-cocoa-performance as the package URL
Set Dependency Rule exact version to v3.0.0, then click Add Package.
Manual Installation
Clone the BugSnag Performance GitHub repository into a local directory providing the version tag after --branch:
git clone --branch v3.0.0 https://github.com/bugsnag/bugsnag-cocoa-performance
Drag BugsnagPerformance.xcodeproj into your Xcode workspace.
Select your project in the Project Navigator and in the project editor that appears, select your app’s target.
Under the General tab, click the Frameworks, Libraries and Embedded Content section’s + button and select BugsnagPerformance.framework (from BugsnagPerformance).
The latest available version of bugsnag-cocoa-performance is v3.0.0.
Basic configuration
Configure your API key by adding a bugsnag Dictionary to your Info.plist file:
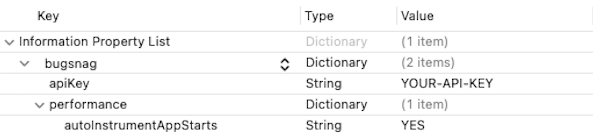
Or in XML:
<key>bugsnag</key>
<dict>
    <key>apiKey</key>
    <string>YOUR-API-KEY</string>
</dict>
This is the same API key and the same plist key used by the BugSnag Error Monitoring library.
You can find your API key in your project’s settings (shortcut: gs) in the dashboard.
App Delegate
If your app implements an app delegate, import the BugsnagPerformance module and initialize BugsnagPerformance in the application:didFinishLaunchingWithOptions: method:
#import <BugsnagPerformance/BugsnagPerformance.h>

@implementation AppDelegate
- (BOOL)application:(UIApplication *)application
        didFinishLaunchingWithOptions:(NSDictionary *)launchOptions {
    [BugsnagPerformance start];
    return YES;
}
import BugsnagPerformance

@UIApplicationMain
class AppDelegate: UIResponder, UIApplicationDelegate {
    func application(_ application: UIApplication,
                     didFinishLaunchingWithOptions launchOptions:
                     [UIApplication.LaunchOptionsKey: Any]?) -> Bool {
        BugsnagPerformance.start()
        return true
    }
}
Like us, some other monitoring vendor SDKs make use of the Activity Tracing API. This API does not play well with multiple consumers. Attempting to use BugSnag Performance alongside one of these other SDKs may have unwanted impact on the data collected.
Instrumenting app starts
BugSnag will automatically detect and report app starts, measuring them from the process start time for the app until the first view finishes loading or when UIApplicationDidBecomeActiveNotification is received, if no view loads occur within the first 1.5 seconds. These timings are shown under the “App starts” tab in the BugSnag Performance dashboard.
The instrumentation determines whether the app is being launched for the first time since installation or reboot and so is a full “cold” start or is otherwise a “warm” start. These two app start types are displayed separately on your BugSnag dashboard.
To disable automatic instrumentation, set the autoInstrumentAppStarts configuration option:
BugsnagPerformanceConfiguration *config = [BugsnagPerformanceConfiguration loadConfig];
config.autoInstrumentAppStarts = NO;
[BugsnagPerformance startWithConfiguration:config];
let config = BugsnagPerformanceConfiguration.loadConfig()
config.autoInstrumentAppStarts = false
BugsnagPerformance.start(configuration: config)
App start types
You can also categorize your app starts further, for example to track the app start period for logged-in users separately to new users. These will be displayed on your dashboard, separated into the warm and cold starts described above.
To set the app start type, use the following code during the app start period:
    BugsnagPerformanceAppStartSpanQuery *appStartTypeQuery =
        [BugsnagPerformanceAppStartSpanQuery query];
    BugsnagPerformanceAppStartSpanControl *spanControl =
        [BugsnagPerformance getSpanControlsWithQuery:appStartTypeQuery];
    if (spanControl != nil) {
        [spanControl setType:@"logged-in-user"];
    }
    let query = BugsnagPerformanceAppStartSpanQuery()
    let spanControl = BugsnagPerformance.getSpanControls(with: query)
        as! BugsnagPerformanceAppStartSpanControl?
    spanControl?.setType("logged-in-user")
Instrumenting view loads
BugSnag will automatically detect and report UIViewController loads, measuring the time taken by any controllers in your app between loadView and viewDidAppear being called. These timings are shown under the “Screen loads” tab in the BugSnag Performance dashboard.
See our SwiftUI guide for instructions on setting up instrumentation for SwiftUI based apps.
Automatic capture of view loads is enabled by default and can be disabled using the autoInstrumentViewControllers configuration option:
BugsnagPerformanceConfiguration *config = [BugsnagPerformanceConfiguration loadConfig];
config.autoInstrumentViewControllers = NO;
[BugsnagPerformance startWithConfiguration:config];
let config = BugsnagPerformanceConfiguration.loadConfig()
config.autoInstrumentViewControllers = false
BugsnagPerformance.start(configuration: config)
This instrumentation relies on Objective-C method “swizzling” and is injected early in your app’s startup code. See our guide on Method swizzling usage for full details on which methods are affected and how it can be fully disabled if required.
If you want control over which views are automatically instrumented, you can implement a viewControllerInstrumentationCallback:
BugsnagPerformanceConfiguration *config = [BugsnagPerformanceConfiguration loadConfig];

// Implement a callback that will be called when a view is created
config.viewControllerInstrumentationCallback = ^(UIViewController *viewController){

    // Return false if viewController is a subclass of MyIgnoredViewController,
    // where viewController is the view that has just been created
    return ![viewController isKindOfClass:[MyIgnoredViewController class]];
};
[BugsnagPerformance startWithConfiguration:config];
let config = BugsnagPerformanceConfiguration.loadConfig()

// Implement a callback that will be called when a view is created
config.viewControllerInstrumentationCallback = { viewController in

    // Return false if viewController is a subclass of MyIgnoredViewController,
    // where viewController is the view that has just been created
    !(viewController is MyIgnoredViewController)
}
BugsnagPerformance.start(configuration: config)
When the callback returns false, the view will not be recorded. This also allows you to manually instrument the view in order to control the start and end of the measurement yourself.
Our automatic instrumentation does not include “container” view controllers (e.g. UITabViewController) as these don’t present any actual view themselves and so any performance impact of these views is out of a developer’s control. If you have custom container view controllers, these will be picked up in the automatic instrumentation and we recommend you exclude these using the above callback.
Pre-loaded views
In some cases, such as for screens in a UITabViewController, views will be “pre-loaded” by the OS before a user has navigated to them and made them visible. This results in a faster render if the view is later loaded, but presents some challenges for presenting and understanding measurements taken as they can occur a long time before the view load completes. Our instrumentation attempts to detect that a pre-load has occurred and creates two view load spans - the initial “pre-load”, and the “presenting” phase when the view is made visible to the user.
Loading indicators
Some views are responsible for showing data fetched from a database or over the network. To track the loading time of the data you can use Loading Indicator view. The loading phase will be marked as finished automatically when the view disappears. You can also mark the finish manually by calling finishLoading method. Loading Indicator doesn’t have to be the root view, it can be added as a sub-view.
class CustomViewController: UIViewController {
    var loadingIndicator: BugsnagPerformanceLoadingIndicatorView!

    override func loadView() {
        loadingIndicator = BugsnagPerformanceLoadingIndicatorView()
        view = loadingIndicator
    }

    func finishLoading() {
        loadingIndicator.finishLoading()
    }
}
Loading Indicator can also be added via Interface Builder. View’s class can be changed to BugsnagPerformanceLoadingIndicatorView and then it can be assigned to an IBOutlet property.
class ViewController: UIViewController {
    @IBOutlet var loadingIndicatorView: BugsnagPerformanceLoadingIndicatorView!
    ...
}
Generic view controllers
If your app uses a UIViewController that is a Swift generic class, it is not possible to intercept the events necessary to measure the load period. Such view controllers can be instrumented manually using the bugsnagTraced API in the BugsnagPerformanceSwift package.
For example, with the following generic declaration:
class ViewControllerFromGeneric<T>: UIViewController {
    override func viewDidLoad() {
        // ...
    }
}

class SubclassedViewControllerFromGeneric: ViewControllerFromGeneric<AppConcreteClass> {
    // ...
}
The bugsnagTraced method should be used on each instance of the generic that you want to measure:
import BugsnagPerformanceSwift

@IBAction func showView(_ sender: Any) {

    let vc = ViewControllerFromGeneric<AppConcreteClass>().bugsnagTraced("an optional name")
    // or:
    // let vc = SubclassedViewControllerFromGeneric().bugsnagTraced("an optional name")

    show(vc, sender: sender)
}
SwiftUI
If your app uses SwiftUI, view load measurements can be easily captured on your BugSnag dashboard using our SwiftUI package. See our SwiftUI guide for installation and usage instructions.
Manual instrumentation
To instrument view loads manually, call startViewLoadSpan with a view name and type:
- (void)viewDidLoad {
    self.span = [BugsnagPerformance
                 startViewLoadSpanWithName:@"MyViewController"
                 viewType:BugsnagPerformanceViewTypeUIKit];
    [super viewDidLoad];
}

- (void)viewDidAppear:(BOOL)animated {
    [super viewDidAppear:animated];
    [self.span end];
}
override func viewDidLoad() {
    span = BugsnagPerformance.startViewLoadSpan(
        name: "MyViewController", viewType: .uiKit)
    super.viewDidLoad()
}

override func viewDidAppear(_ animated: Bool) {
    super.viewDidAppear(animated);
    span?.end()
    span = nil
}
Instrumenting network requests
BugSnag will automatically detect and report network requests in your app made through URLSession. These timings are shown under the “Network requests” tab in the BugSnag Performance dashboard.
Automatic capture of network requests is enabled by default and can be disabled using the autoInstrumentNetworkRequests configuration option:
BugsnagPerformanceConfiguration *config = [BugsnagPerformanceConfiguration loadConfig];
config.autoInstrumentNetworkRequests = NO;
[BugsnagPerformance startWithConfiguration:config];
let config = BugsnagPerformanceConfiguration.loadConfig()
config.autoInstrumentNetworkRequests = false
BugsnagPerformance.start(configuration: config)
This instrumentation relies on Objective-C method “swizzling” and is injected early in your app’s startup code. See our guide on Method swizzling usage for full details on which methods are affected and how it can be fully disabled if required.
Manual instrumentation
To instrument network requests manually, call reportNetworkRequestSpan from your
URLSessionTaskDelegate URLSession:task:didFinishCollectingMetrics method:
- (void)URLSession:(NSURLSession *)session task:(NSURLSessionTask *)task
                     didFinishCollectingMetrics:(NSURLSessionTaskMetrics *)metrics {
    [BugsnagPerformance reportNetworkRequestSpanWithTask:task metrics:metrics];
}
func urlSession(_ session: URLSession, task: URLSessionTask,
                didFinishCollecting metrics: URLSessionTaskMetrics) {
    BugsnagPerformance.reportNetworkRequestSpan(task: task, metrics: metrics)
}
The networkRequestCallback configuration option allows you to control the data sent in these network request spans using a callback.
Sending custom spans
To send custom spans to BugSnag for any other operations you wish to measure, use BugsnagPerformance.startSpan to start a span, and call the span’s end method to end the measurement:
BugsnagPerformanceSpan *span = [BugsnagPerformance startSpanWithName:@"login"];
[api login:^(BOOL success){
    [span end];
}];
let span = BugsnagPerformance.startSpan(name: "login")
api.login { _ in
    span.end()
}
The options parameter allows you to customize some elements of the span’s behavior:
Reporting child-only spans
If a custom span is “first class”, its performance characteristics will be aggregated and shown in the “Custom” tab of the BugSnag dashboard. If the custom span is useful only for adding insight into the performance of its parent (through the waterfall diagram on the span instance page), you should set the isFirstClass span option to false:
BugsnagPerformanceSpanOptions *options = [BugsnagPerformanceSpanOptions new];
options.firstClass = BSGFirstClassNo;
[BugsnagPerformance startSpanWithName:@"always-nested" options:options];
BugsnagPerformance.startSpan(
    name: "always-nested",
    options: BugsnagPerformanceSpanOptions.setFirstClass(BSGFirstClass.no))
Controlling span hierarchies
When viewing a single instance of a span in the BugSnag dashboard, a waterfall diagram will show you that instance’s children and their children, and so on. This allows you to see in more detail where the time was spent, and aid diagnosing and fixing any problems. Usually this will be automatically managed by BugSnag, however when creating your own spans, you can use the options parameter to control their parent-child relationships to produce a meaningfully representative hierarchy in your dashboard. See Maintaining span context for more information.
Start and end time overrides
By default, a span will use the current timestamp as its start time. However, you can use the startTime span option to report spans that have already started by providing your own timestamp. You can also end a span with your own timestamp to provide a retrospective end time:
NSDate *taskStartTime = [NSDate date];

// When the task has completed:
NSDate *taskEndTime = [NSDate date];

BugsnagPerformanceSpanOptions *options = [BugsnagPerformanceSpanOptions new];
options.startTime = taskStartTime;
BugsnagPerformanceSpan *span1 = [BugsnagPerformance startSpanWithName:@"retrospective-span"
                                                              options:options];
[span1 endWithEndTime:taskEndTime];
let taskStartTime = Date()

// When the task has completed:
let taskEndTime = Date()

BugsnagPerformance.startSpan(
    name: "retrospective-span",
    options: BugsnagPerformanceSpanOptions.setStartTime(taskStartTime))
.end(endTime: taskEndTime)
Adding custom span attributes
Additional data can be added to spans to help diagnose performance issues. These are sent as span attributes and will be displayed on your Performance dashboard alongside the automatic span data captured by the SDK.
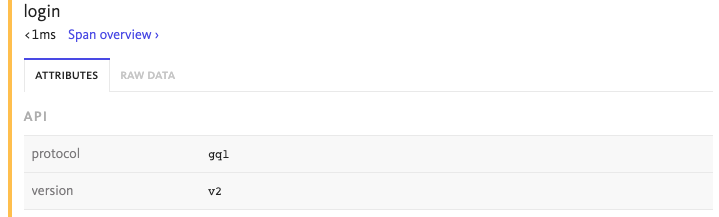
Attributes are added via a span object and are name value pairs where the type can be either a string, integer, double, boolean or an array of one of these types:
BugsnagPerformanceSpan *span = [BugsnagPerformance startSpanWithName:@"span-with-data"];
[span setAttribute:@"api.protocol" withValue:@"gql"];
[span setAttribute:@"api.version" withValue:@"v2"];
let span = BugsnagPerformance.startSpan(name: "span-with-data")
span.setAttribute("api.protocol", withValue: "gql")
span.setAttribute("api.version", withValue: "v2")
You can use a callback to set attributes when they are ending. This allows you to access all spans being generated, including those from automatic instrumentation:
BugsnagPerformanceConfiguration *config = [BugsnagPerformanceConfiguration loadConfig];
[config addOnSpanEndCallback:^BOOL(BugsnagPerformanceSpan * _Nonnull span) {
    [span setAttribute:@"device.locale" withValue: @"en-US"];
    return true;
}];
[BugsnagPerformance startWithConfiguration:config];
let config = BugsnagPerformanceConfiguration.loadConfig()
config.add { span in
    span.setAttribute("device.locale", withValue: "en-US");
    return true;
}
BugsnagPerformance.start(configuration: config)
The number and size of attributes added to spans are limited by the SDK to avoid oversized span payloads that would be rejected by the BugSnag API. See the Custom attribute limit configuration options to see how this can be customized if more data is required.
These callbacks can be executed with a high frequency, so care should be taken not to perform complex operations that will have a detrimental effect on performance. For more information, see the span callbacks configuration option.
Sending app session spans
To measure a longer user or app activity period, use BugsnagPerformance.startAppSessionSpan to start an App Session Span, and call the span’s end method when the session finishes:
BugsnagPerformanceSpan *span = [BugsnagPerformance startAppSessionSpan:@"audio-playback"];
[player play];
// When the session has completed:
[span end];
let span = BugsnagPerformance.startAppSessionSpan("audio-playback")
player.play()
// When the session has completed:
span.end()
App Session Spans are useful for measuring resource usage across longer-running app experiences, such as media playback, navigation, calls, or other user sessions.
Background Execution Support for Session Capture
App Session Spans can remain open while the app is in the background. Resource metrics continue to be captured only while iOS allows the app to keep executing in the background.
For example, media apps must configure the appropriate background mode and playback session so iOS continues running the app:
<key>UIBackgroundModes</key>
<array>
    <string>audio</string>
</array>
For location or navigation apps, use the matching background mode required by iOS such as:
<key>UIBackgroundModes</key>
<array>
    <string>location</string>
</array>
Adding session span attributes
Additional data can be added to App Session Spans using the returned span object:
let span = BugsnagPerformance.startAppSessionSpan("video-playback")

span.setAttribute("media.type", withValue: "video")
span.setAttribute("media.source", withValue: "streaming")
BugsnagPerformanceSpan *span =
    [BugsnagPerformance startAppSessionSpan:@"video-playback"];

[span setAttribute:@"media.type" withValue:@"video"];
[span setAttribute:@"media.source" withValue:@"streaming"];
Attributes should use stable names and low-cardinality values. Avoid adding unique user IDs, URLs, timestamps, or other high-cardinality values unless required.
Ending App Session Spans
Always end the App Session Span when the measured session is complete:
span.end()
[span end];
Ending the span stops App Session Span metric accumulation immediately. If the span is not ended before the app is terminated, the span may not be sent.
Capturing system metrics
Monitoring key system metrics such as frame rendering durations, CPU usage and memory consumption is essential for maintaining a good user experience in your application. By continuously monitoring these metrics, you can detect performance issues early and prevent further slowdowns or crashes that would have an even bigger impact on your end user experience.
Use the enabledMetrics configuration option to start capturing these metrics in your custom spans:
BugsnagPerformanceConfiguration *config = [BugsnagPerformanceConfiguration loadConfig];
config.enabledMetrics.rendering = YES;
config.enabledMetrics.cpu = YES;
config.enabledMetrics.memory = YES;
[BugsnagPerformance startWithConfiguration:config];
let config = BugsnagPerformanceConfiguration.loadConfig()
config.enabledMetrics.rendering = true
config.enabledMetrics.cpu = true
config.enabledMetrics.memory = true
BugsnagPerformance.start(configuration: config)
For more information about this feature, please see our System metrics guide.