Network request reliability
Monitor network request reliability to assess the health of web services used by your application.
Network request reliability helps you monitor the health and dependability of web services from your application’s perspective. Unlike traditional server-side monitoring, our performance SDKs track 4xx and 5xx error rates as experienced by your users, providing insights into client-side network conditions, such as:
- Mobile network instability – connection drops and timeouts specific to cellular networks.
- Geographic service degradation – regional CDN or proxy issues affecting specific user populations.
- Client-side configuration problems – authentication token expiration, malformed requests, or API version mismatches.
- Third-party service dependencies – external API failures that impact your application but aren’t reflected in your server metrics.
- Edge case scenarios – network conditions that only manifest under specific client environments or usage patterns.
Understanding network request reliability
Network request reliability is assessed based on HTTP response status codes:
- Client errors (400-499) – problems with the request itself such as authentication failures, missing resources or malformed requests.
- Server errors (500-599) - problems with the server processing the request such as internal server errors, service unavailable or gateway timeouts.
The failure rate is calculated as the percentage of requests that returned 4xx or 5xx status codes compared to the total number of requests with response codes.
Reliability overview
Network request reliability metrics are displayed as additional columns in the span groups table for request-oriented spans. This gives you an at-a-glance view of which services or endpoints are experiencing the highest failure rates.

The span groups table displays separate 4xx and 5xx columns showing failure rates for client and server errors respectively. These sortable columns allow you to click column headers to sort by failure rates in ascending or descending order, helping you quickly identify the most problematic services.
Detailed reliability analysis
When you select a specific span group, you’ll see a breakdown of the HTTP responses that provides comprehensive insights into the response patterns. The panel provides two analysis modes, available in the separate tabs:
HTTP Response Classes
The HTTP Response Classes tab displays response classes over time using a stacked area chart that shows trends for 1xx, 2xx, 3xx, 4xx and 5xx response categories.
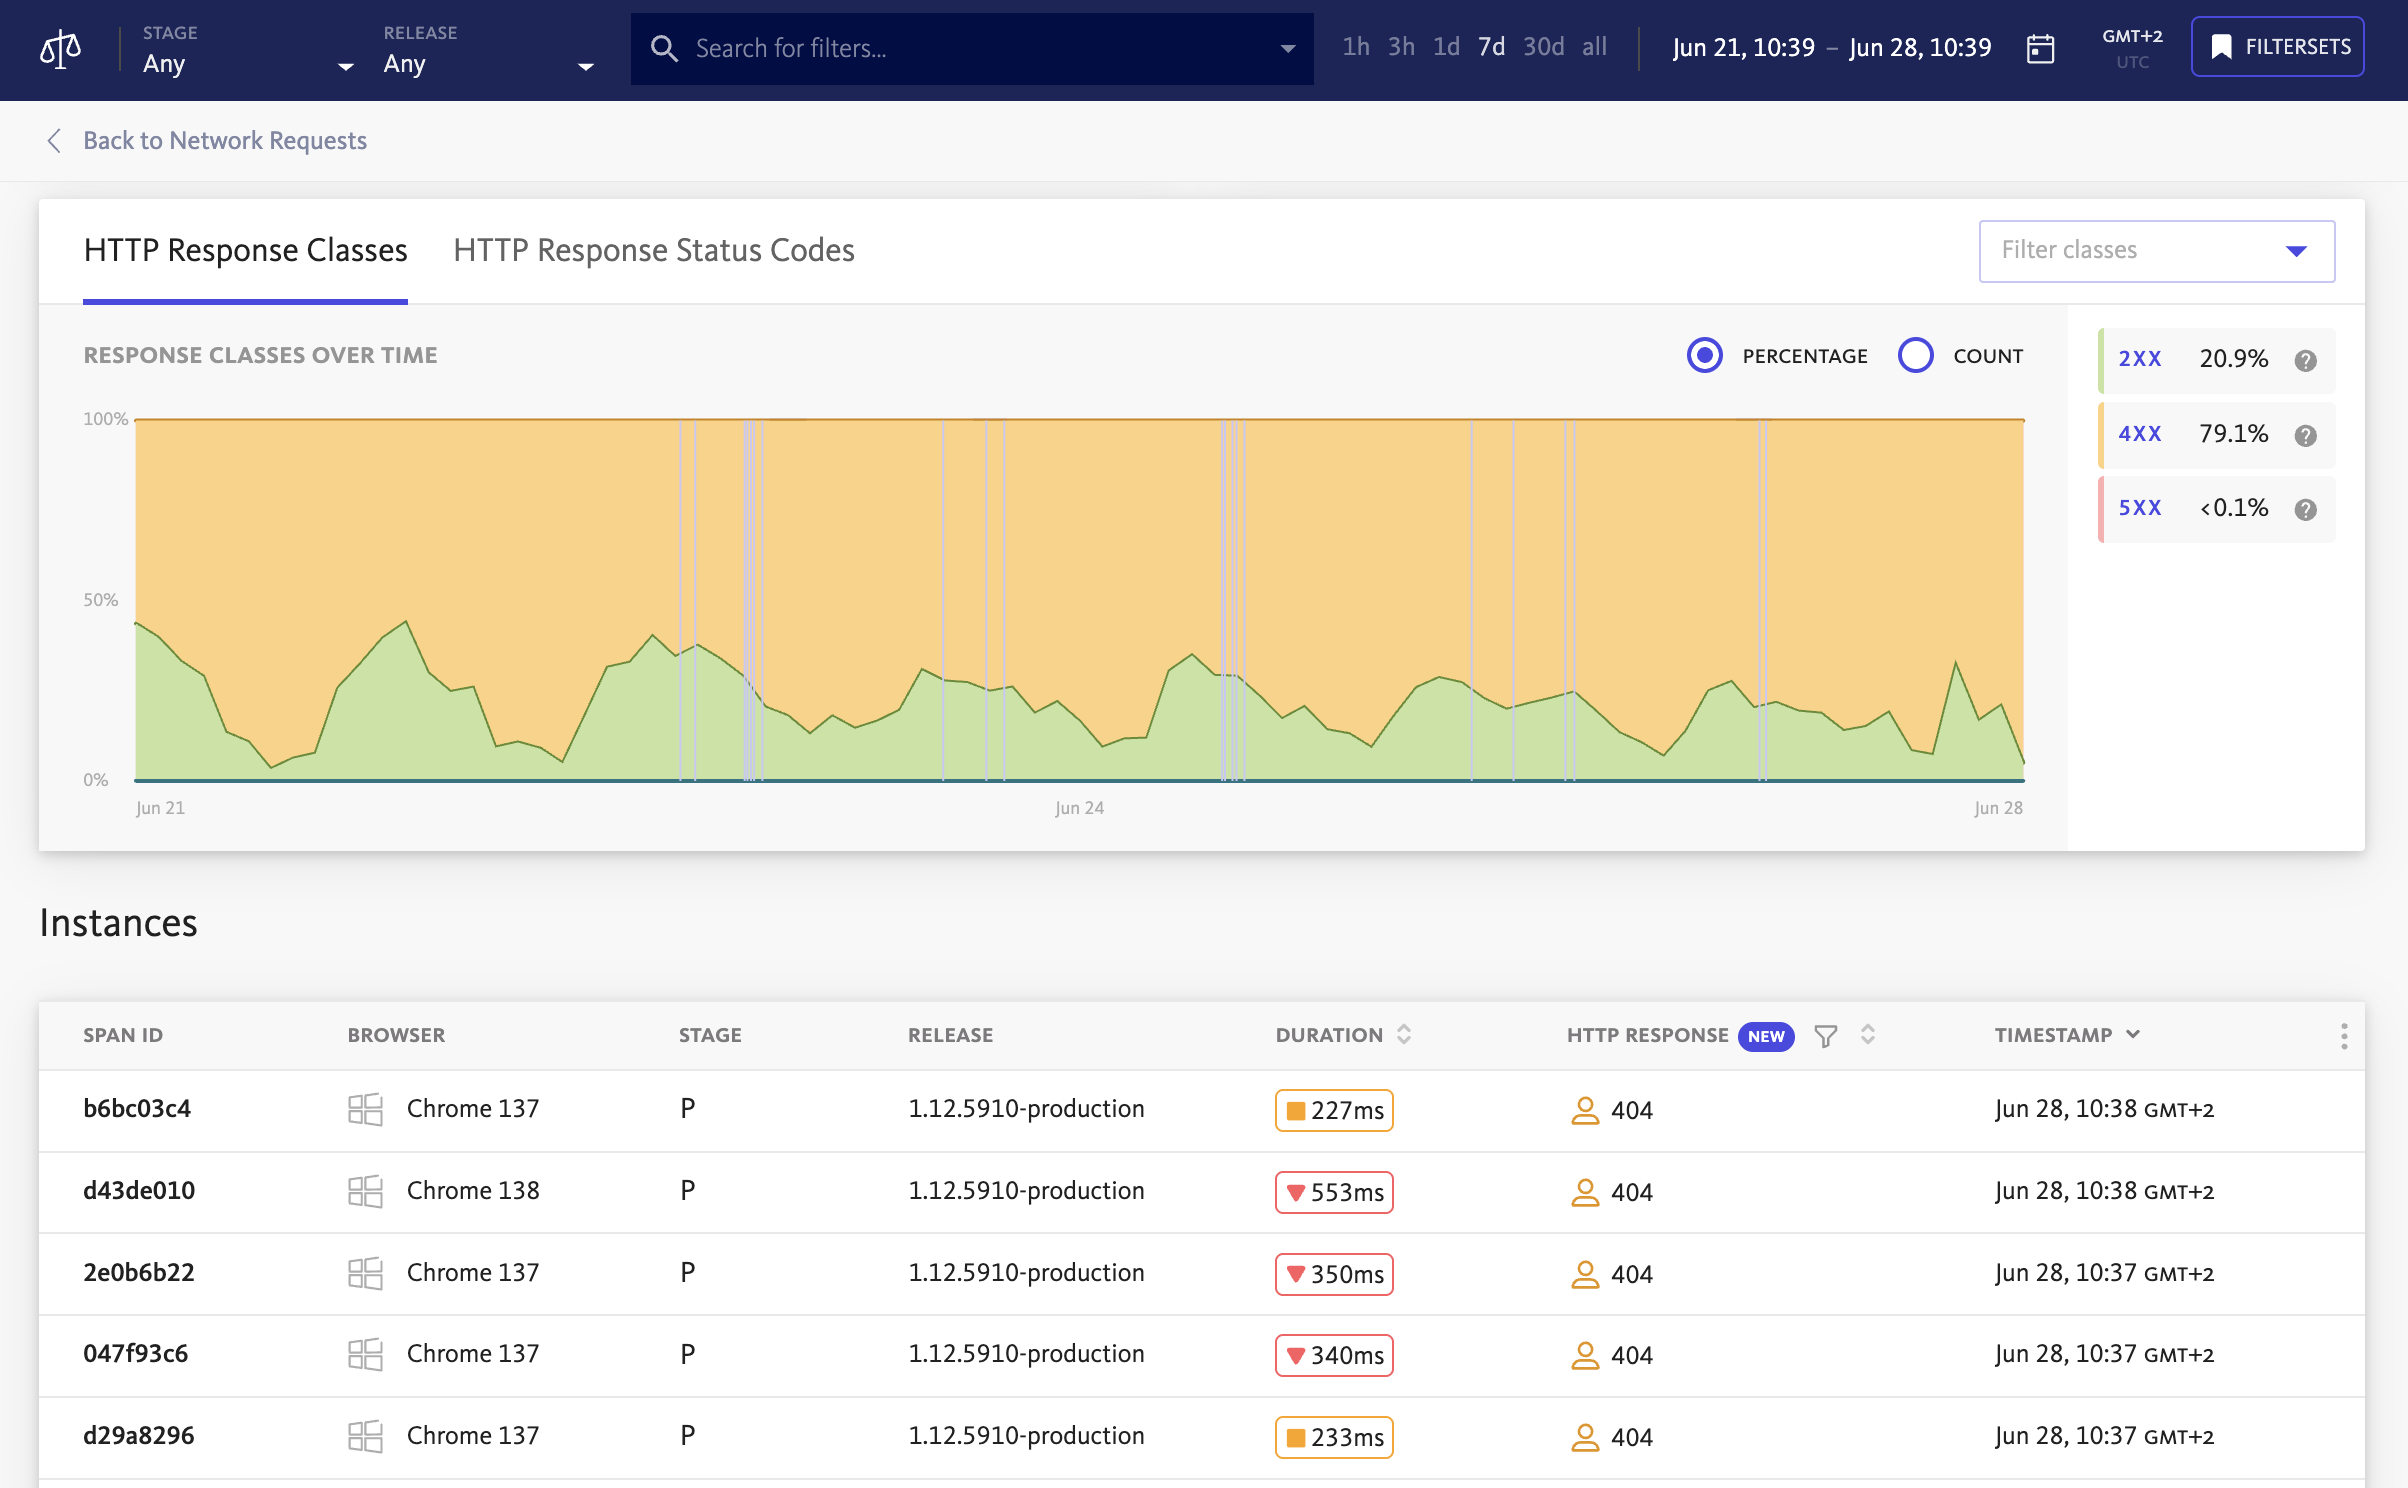
When you select a specific response class, the tab provides a class breakdown with a detailed view of the 5 most common response codes within that selected class. An interactive picker allows you to select all classes for a comprehensive overview or focus on individual response code classes for targeted analysis.
HTTP Response Status Codes
The HTTP Response Codes tab focuses on individual response codes with response codes over time displayed as a stacked area chart for up to 5 selected specific response codes.
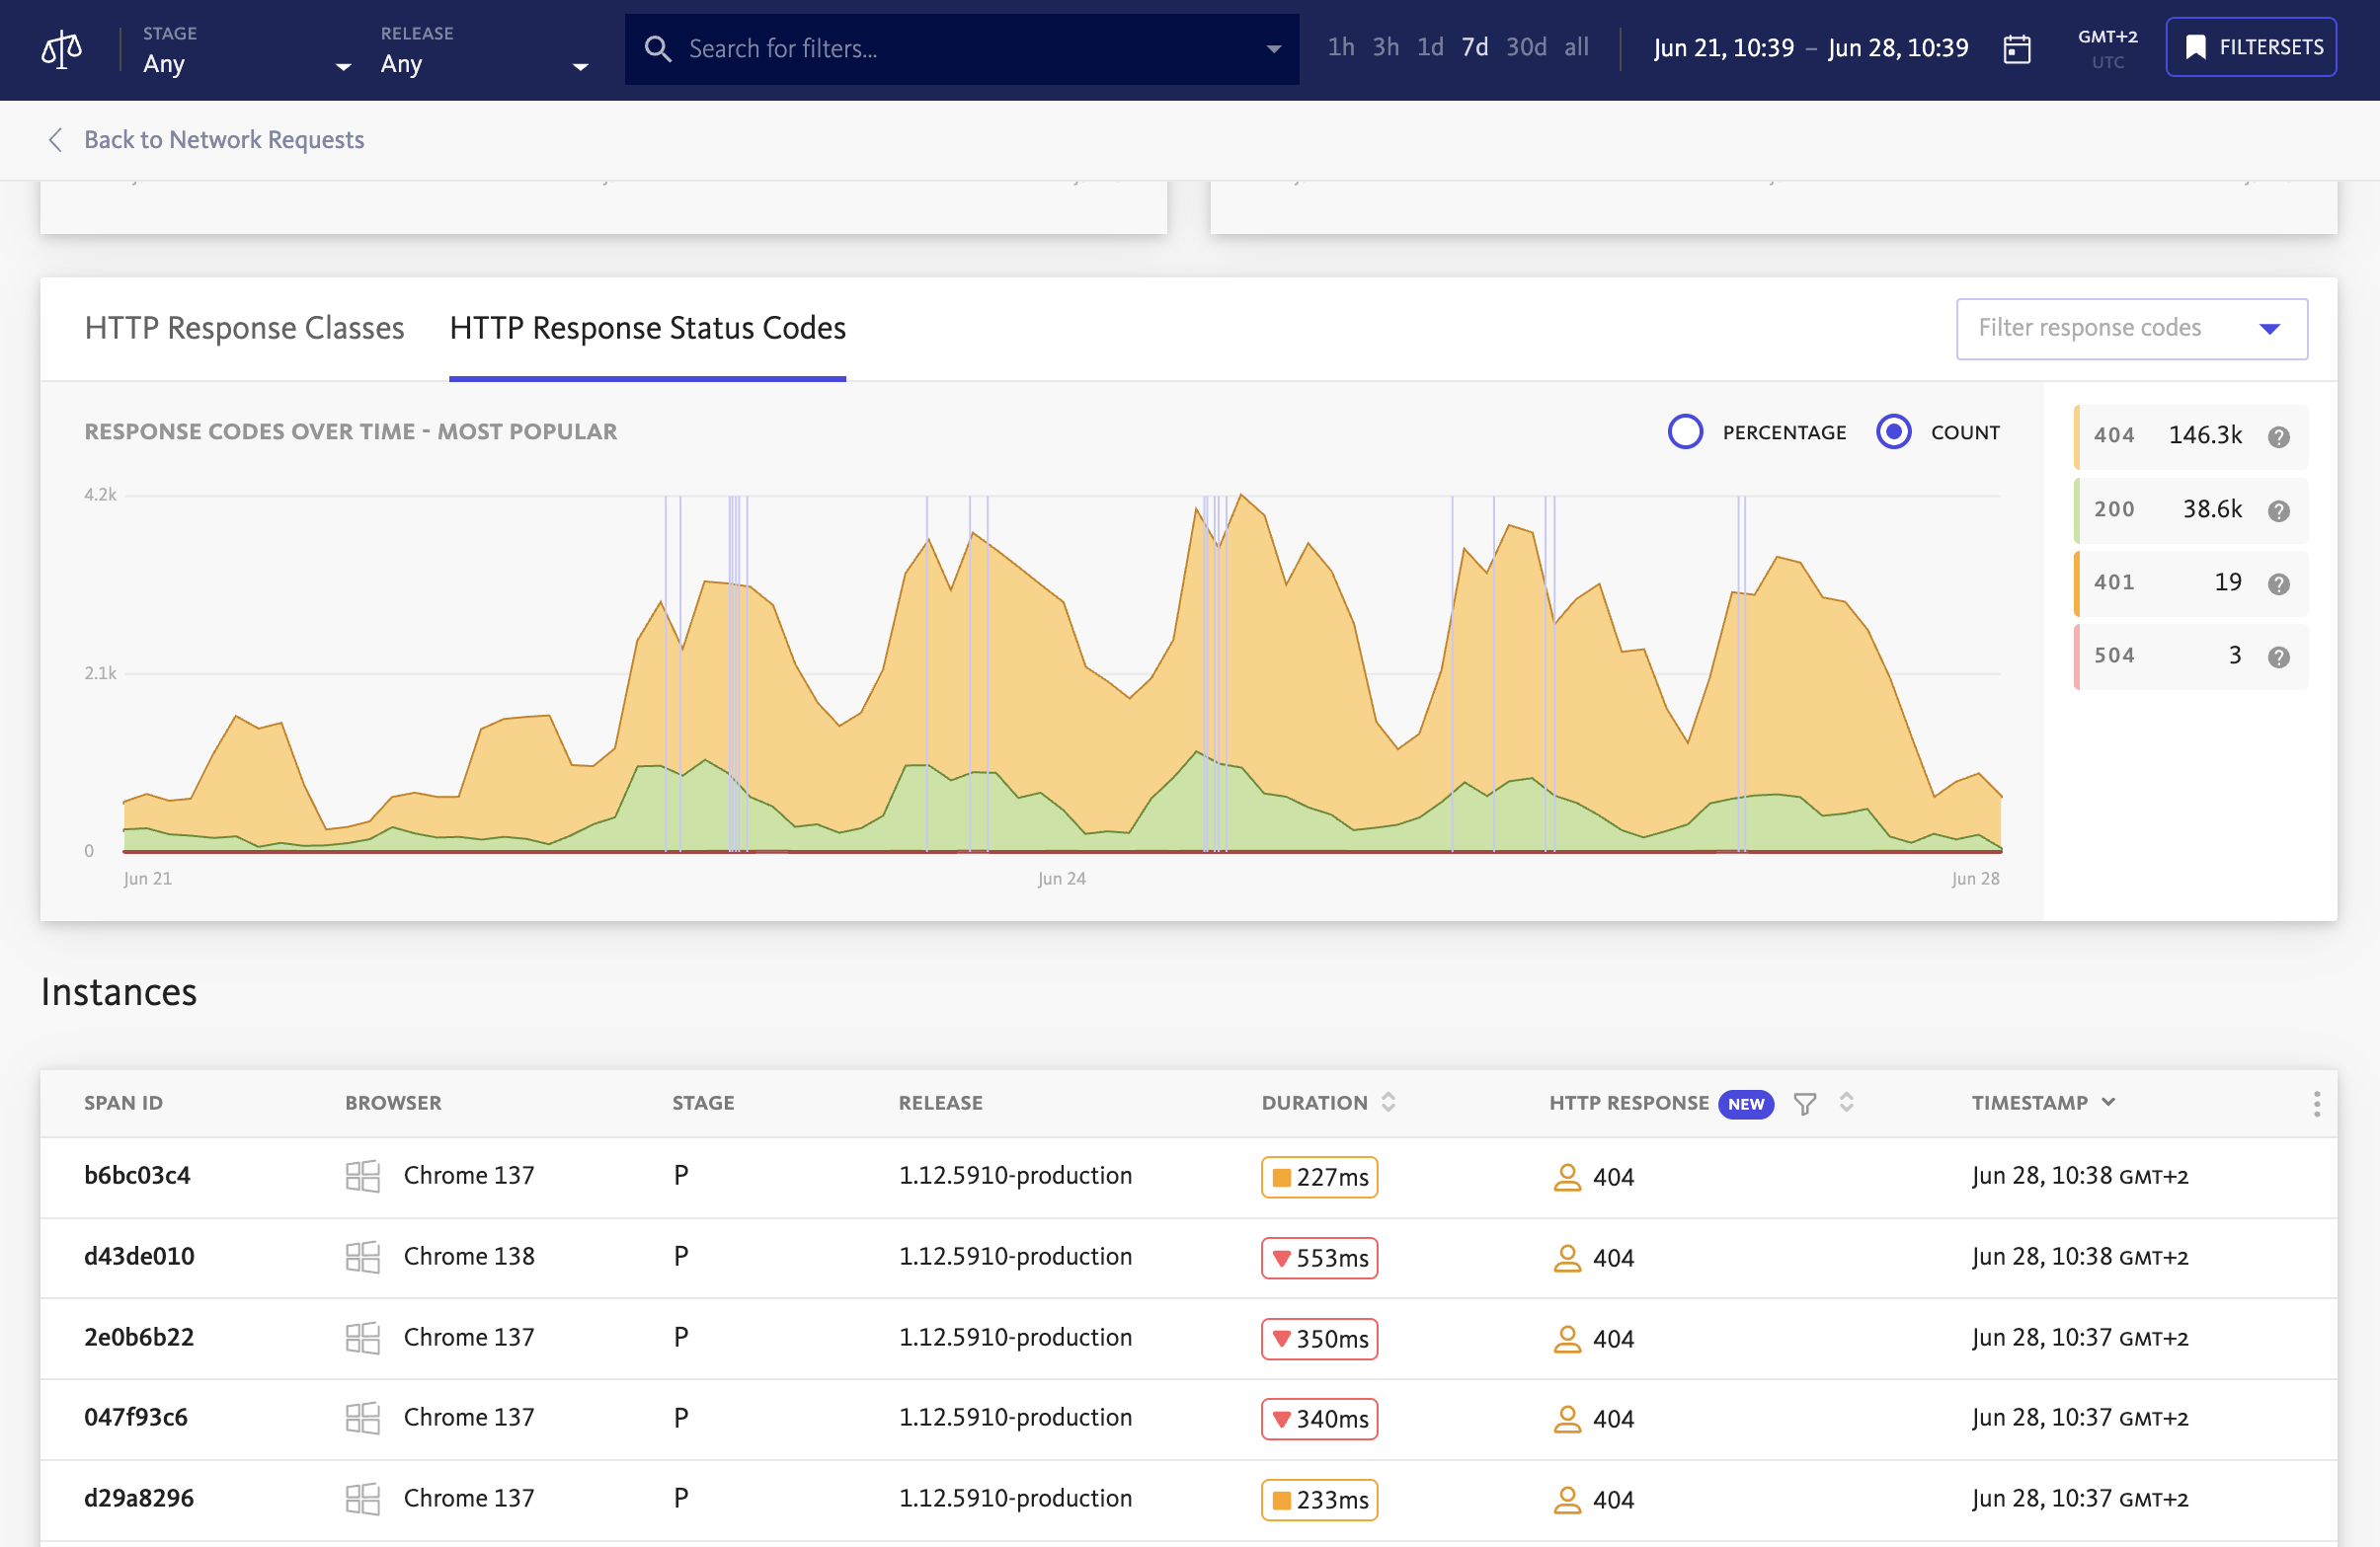
This tab enables multi-code comparison where you can select multiple specific response codes to analyze simultaneously, allowing for detailed comparison of how different error codes trend over time. The analysis supports custom time ranges so you can analyze trends across different time periods, making it easy to correlate response code patterns with deployments, traffic changes or other events.
Both HTTP Response Classes and HTTP Response Codes tabs support switching between percentage and count views. Use percentages to understand how different response types contribute to your overall traffic patterns, or switch to counts to see the actual volume of requests and identify high-traffic periods or sudden spikes in specific response codes.
Each span instance in the details view displays the specific HTTP response code it received, allowing you to trace individual failures and understand the context around specific errors.
Comparison mode
Network request reliability data integrates with comparison mode. It is particularly valuable for network request reliability analysis because it helps isolate the root causes of connectivity issues and performance degradations.
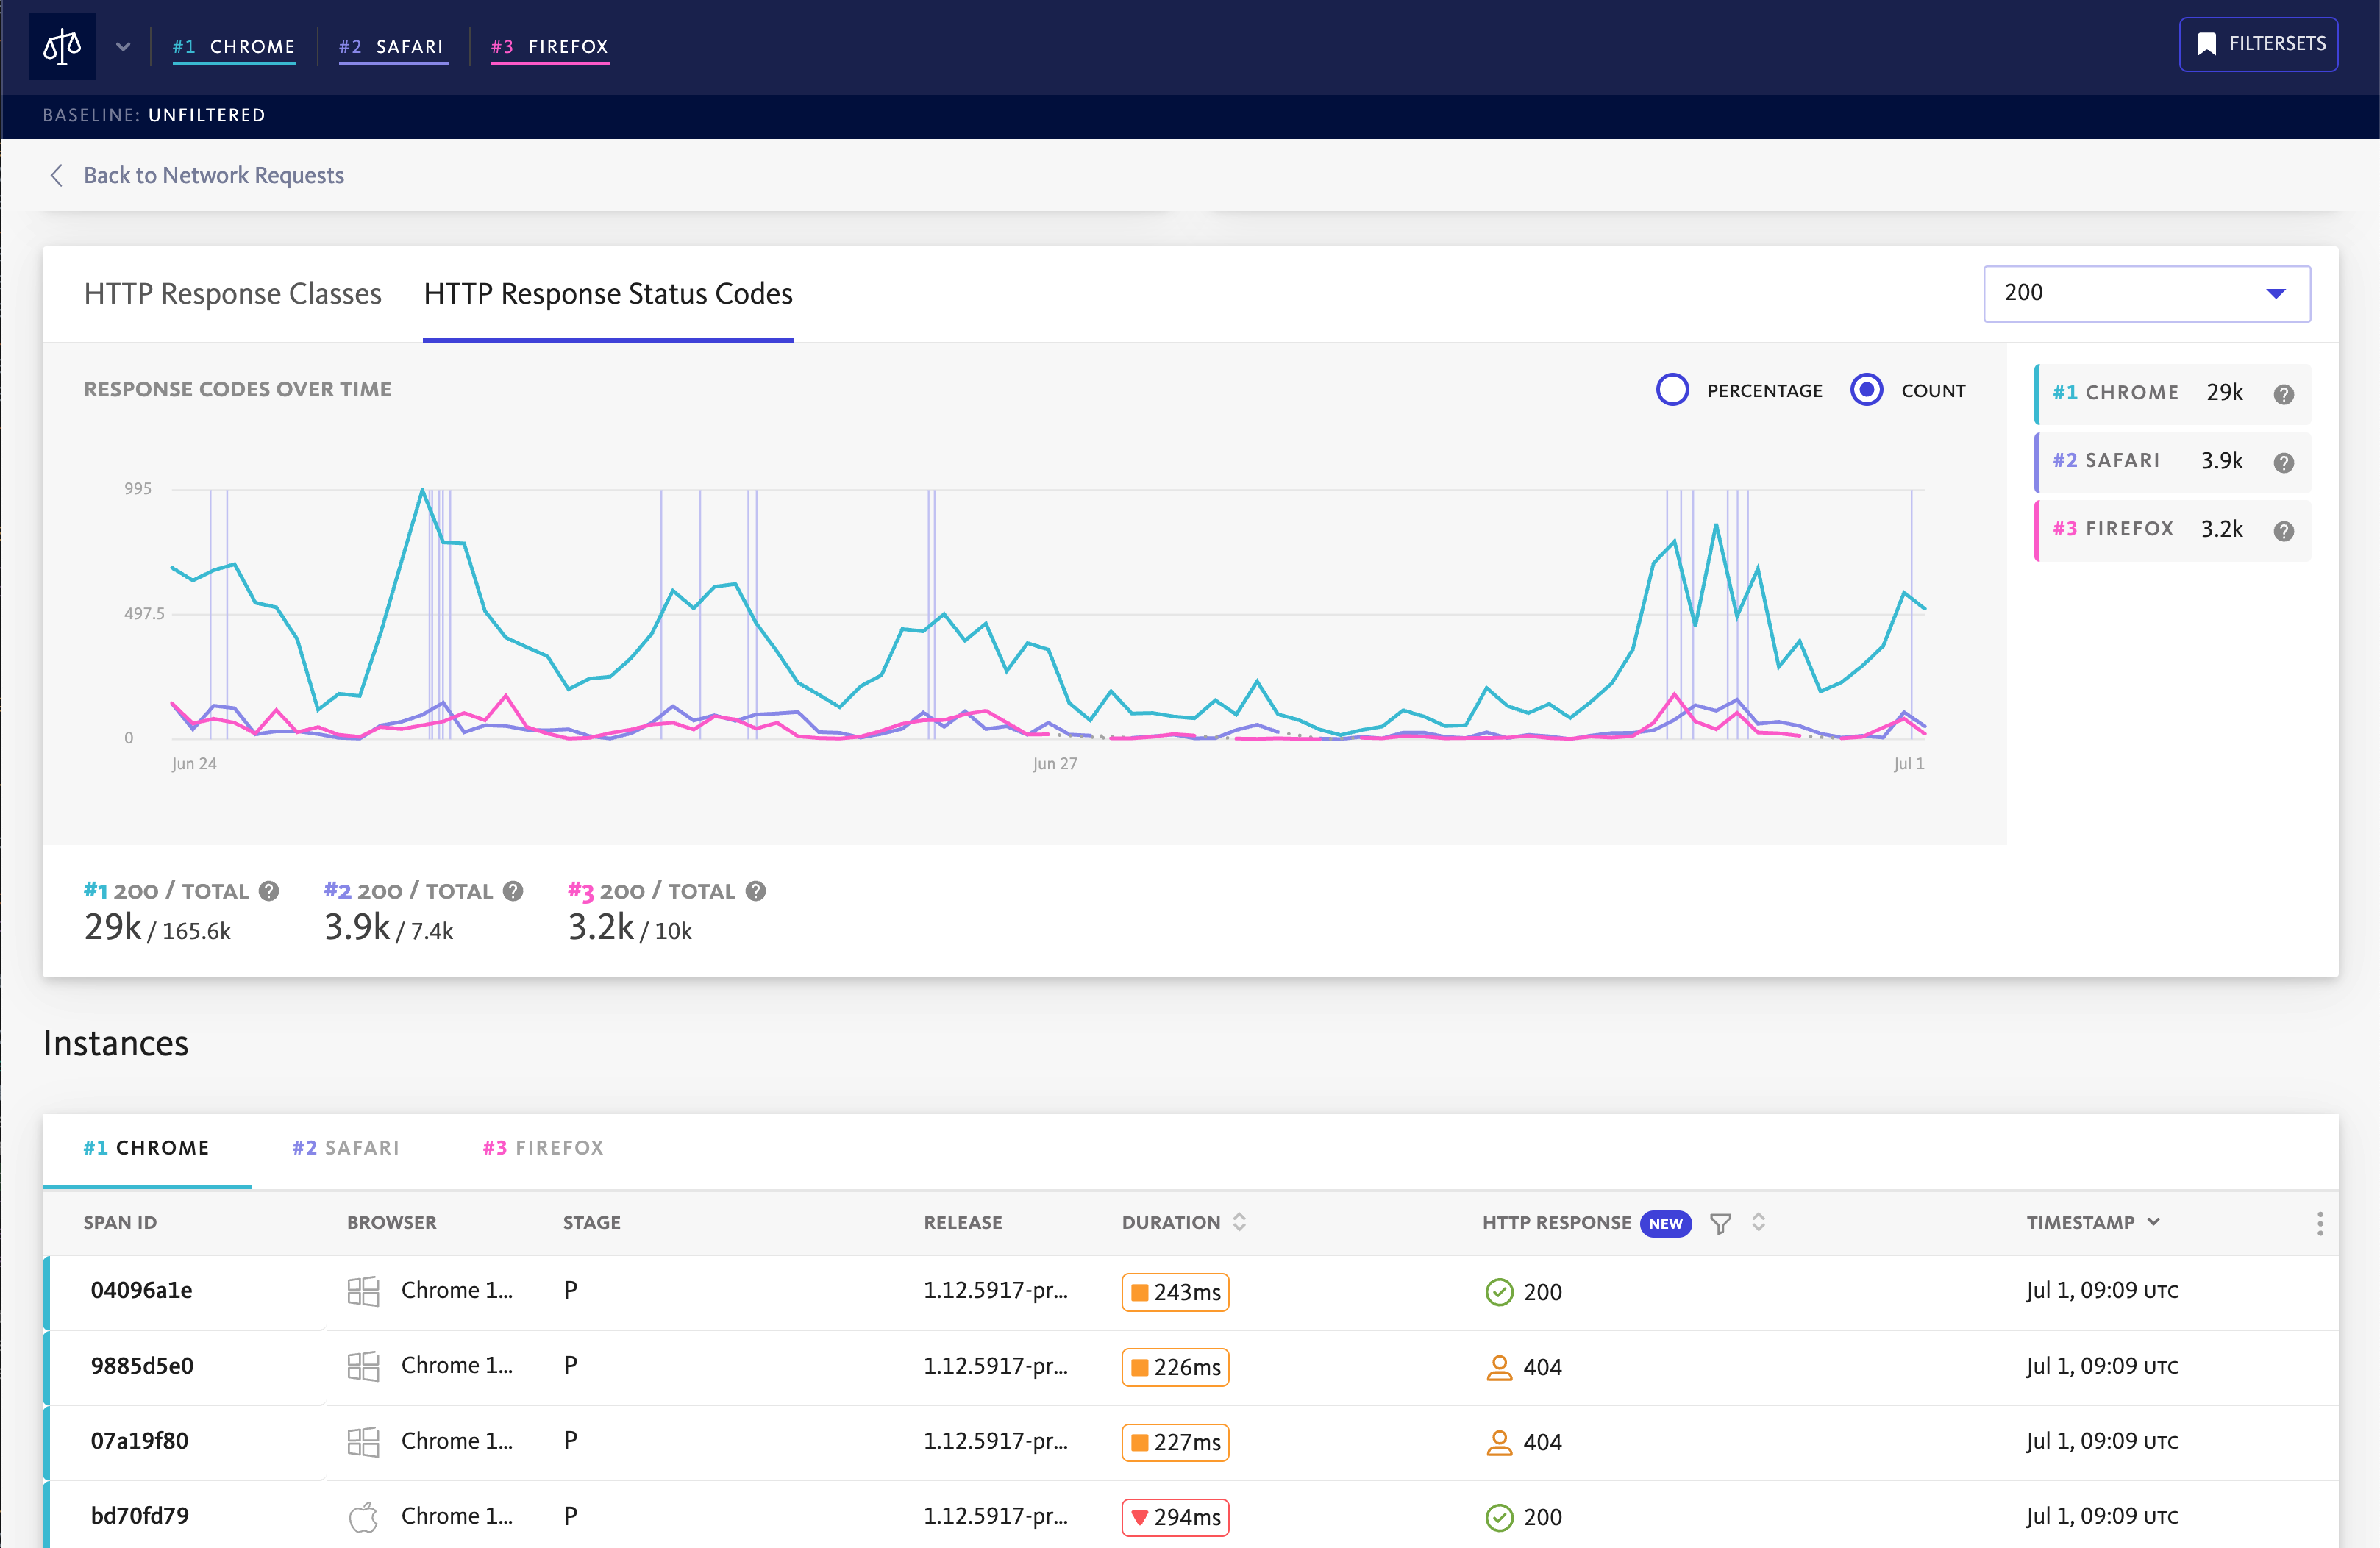
By comparing failure rates across different dimensions, you can determine whether problems are systemic (affecting all users) or specific to certain segments, environments or configurations. This targeted analysis enables faster troubleshooting by eliminating variables and focusing investigation efforts on the most likely culprits, whether they’re recent code changes, infrastructure updates or external service dependencies.
Troubleshooting high failure rates
When you identify poor network request reliability:
- Check the response code distribution – are failures primarily 4xx (client issues) or 5xx (server issues)?
- Review the timeline – when did failures start and was there a recent deployment?
- Examine individual instances – look at specific failed requests for patterns.
- Cross-reference with other metrics – compare with CPU usage, memory or other performance indicators.