Rendering metrics
Monitor rendering metrics to ensure your app is visually smooth with a responsive user interface.
The process of creating a frame from your application and putting it on the screen is known as user interface rendering. Devices use a count of frames per second (FPS) to determine how many frames must be rendered in a one-second timeframe. 60 FPS is the most widely used value, where a single frame should be produced in 16 milliseconds.
Rendering must be efficient enough to satisfy the device’s time requirements in order to guarantee seamless user interaction. If your app misses the deadline to render a frame, it does not result in it being displayed late. Instead, the frame is removed completely so that the user will notice “stuttering” in your app as the system skips these slow frames.
Capturing rendering metrics
The BugSnag Performance SDKs can be configured to capture rendering metrics. It is an opt-in feature that requires some initial configuration in your app. Full instructions can be found in the platform-specific documentation:
Captured data
To help you improve the app’s UI quality, the following rendering metrics are recorded while a span is active:
- Rendered frames – the number of frames that were rendered while the span was active
- Slow frames – the number of frames that missed their rendering deadline (e.g. 16 ms at 60 FPS)
- Frozen frames – the number of frames that took greater than 700 ms to render
- Minimum, maximum and average FPS – the minimum, maximum and average frames per second while the span was active (Unity platform only)
App hangs and ANRs vs slow and frozen frames
App hang terminations on iOS and ANRs on Android are examples of responsiveness issues that can greatly impact users’ perceptions of an app. The problem occurs when an app’s main thread is stalled for an extended time and seems unresponsive. On iOS this may result in your app being terminated and on Android, the user gets the option to force-quit through a dialog.
You can consider these situations as en extreme case of slow UI rendering:
| Slow frames | Frozen frames | ANRs | |
|---|---|---|---|
| Rendering time | Between 16 ms and 700 ms | Between 700 ms and 5 s | Greater than 5 s |
| Visible user impact | Slight stuttering visible on scroll views, animations or screen transitions | UI appears stuck and unresponsive for an extended period | The app is completely unresponsive. |
| Reporting | Span attribute | Span attribute | Error |
Spotting rendering issues
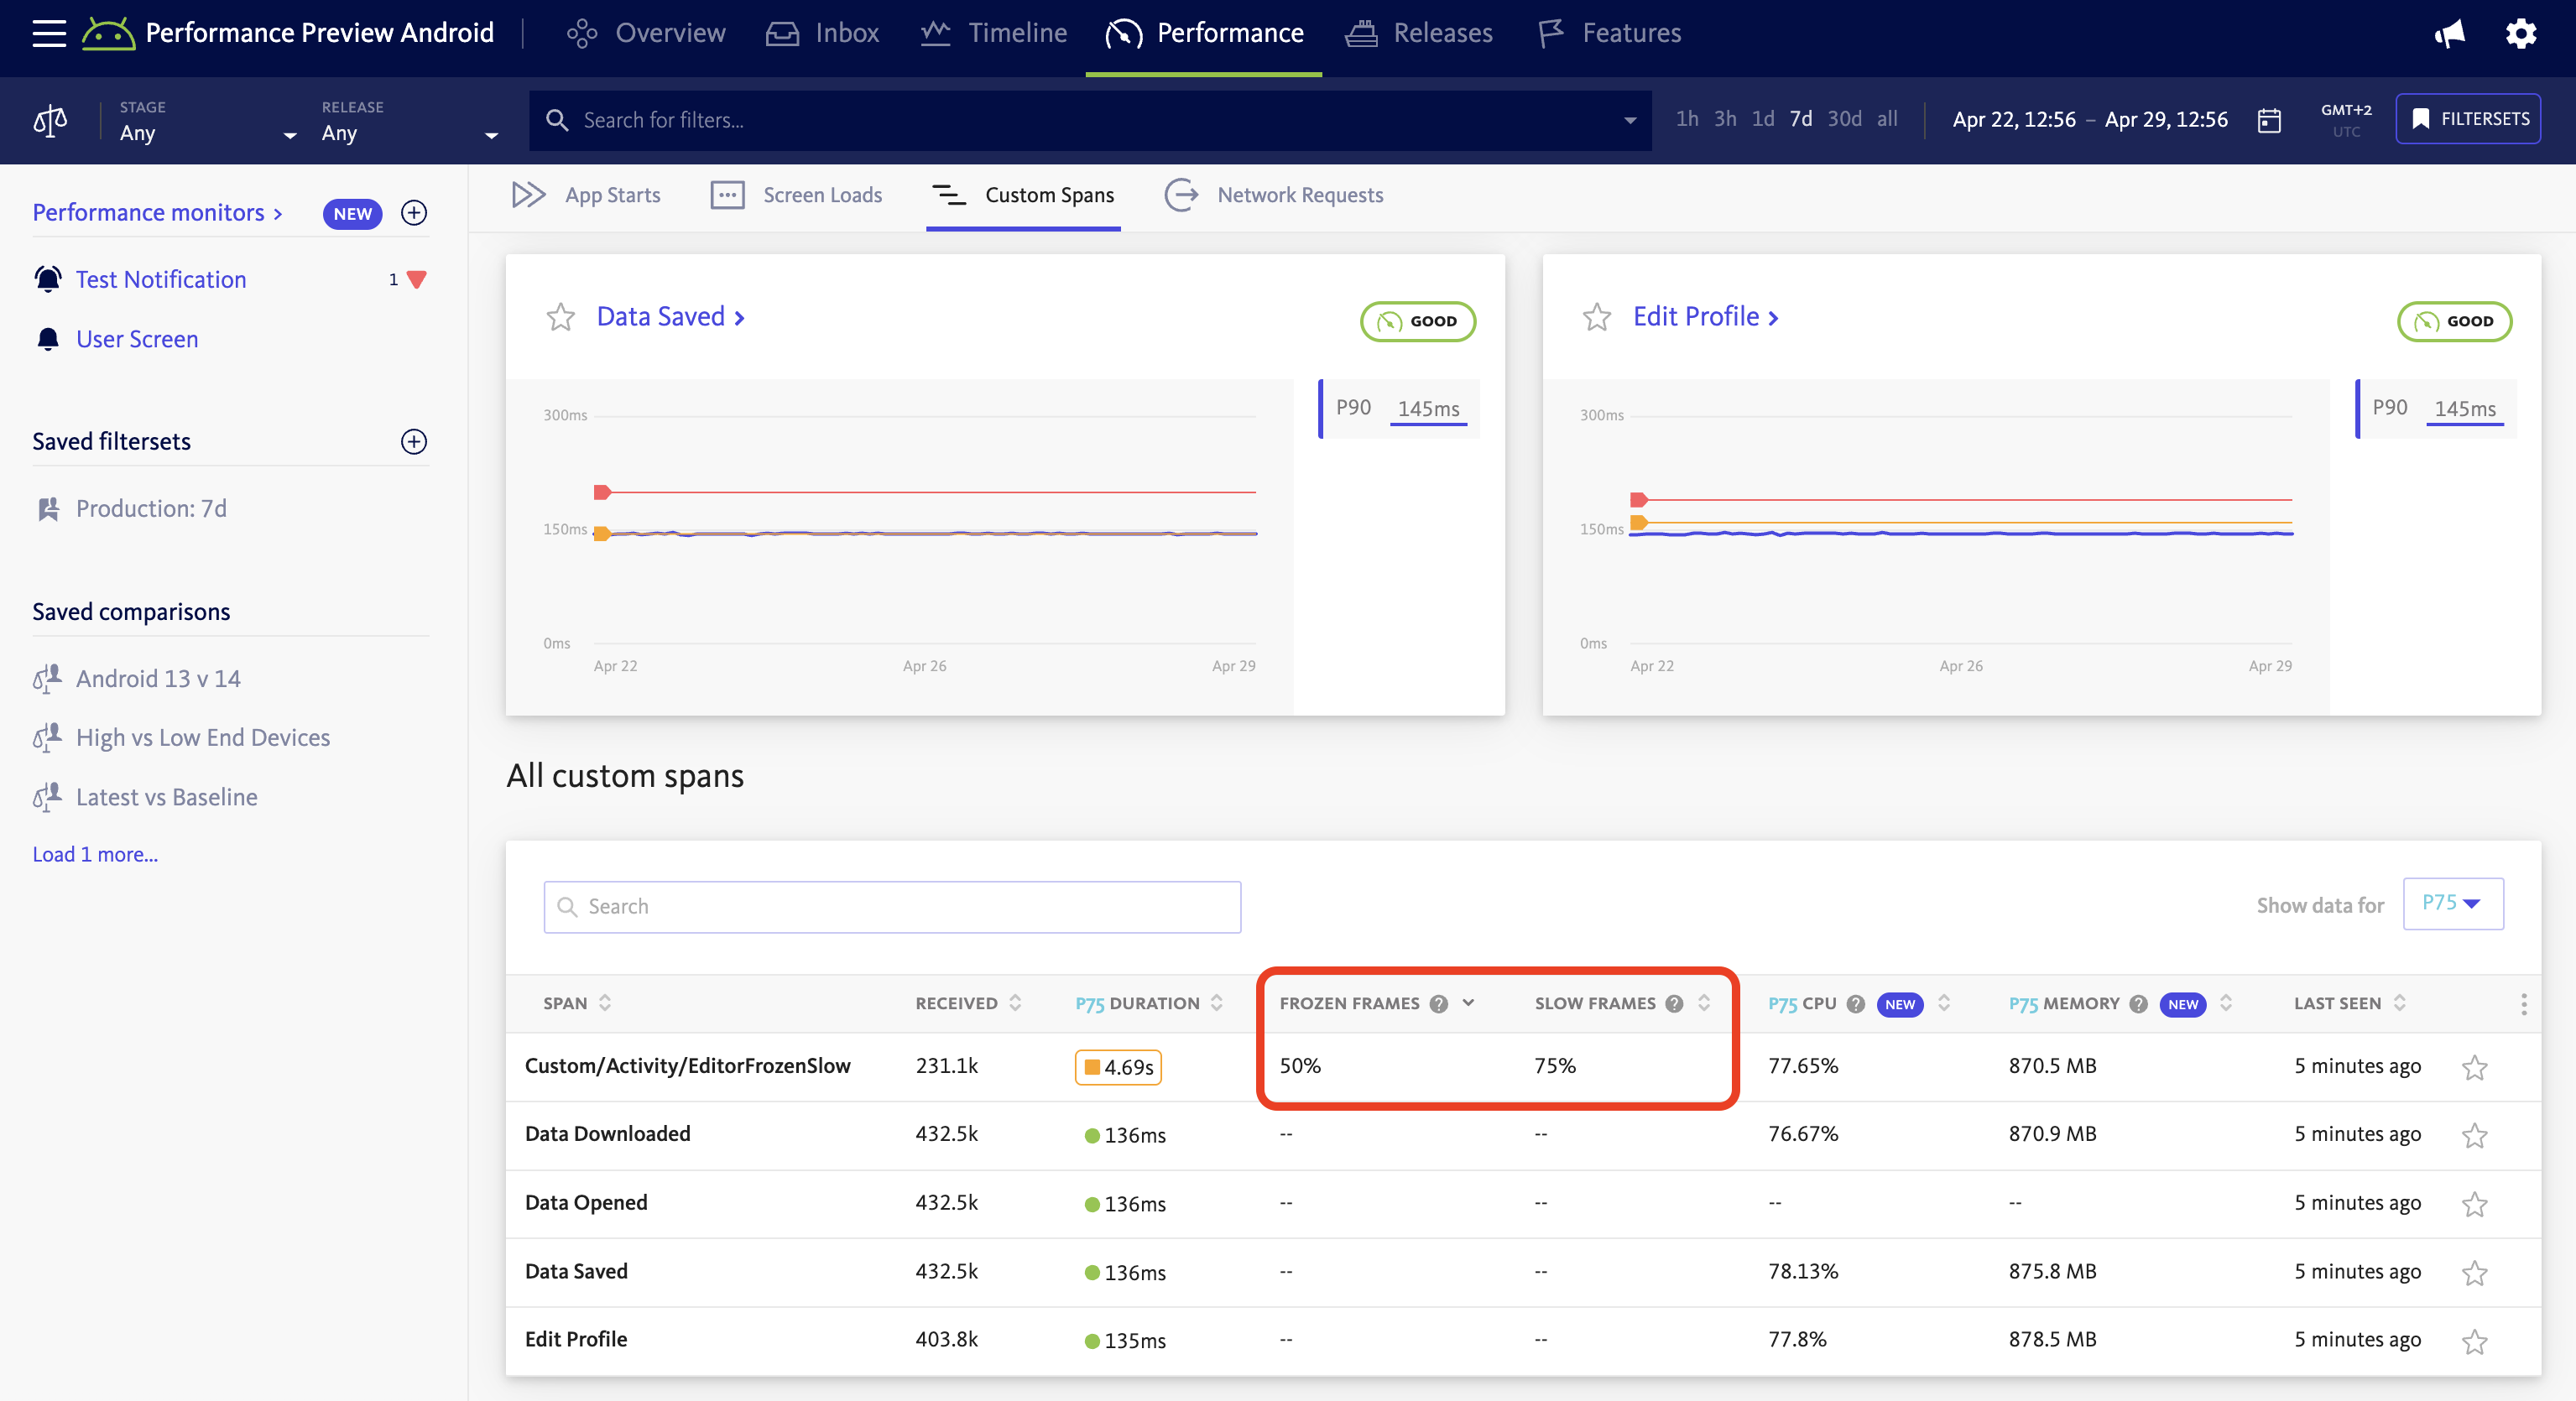
Aggregated rendering metrics are reported for each span group that has sent data. The aggregated data is provided as two columns:
- Frozen Frames – Percentage of qualified span instances where at least one frame render exceeded 700ms
- Slow Frames – Percentage of qualified span instances where at least 25% of frames missed their rendering deadline
A qualified span instance is one that reported rendering data.
Unity FPS metrics
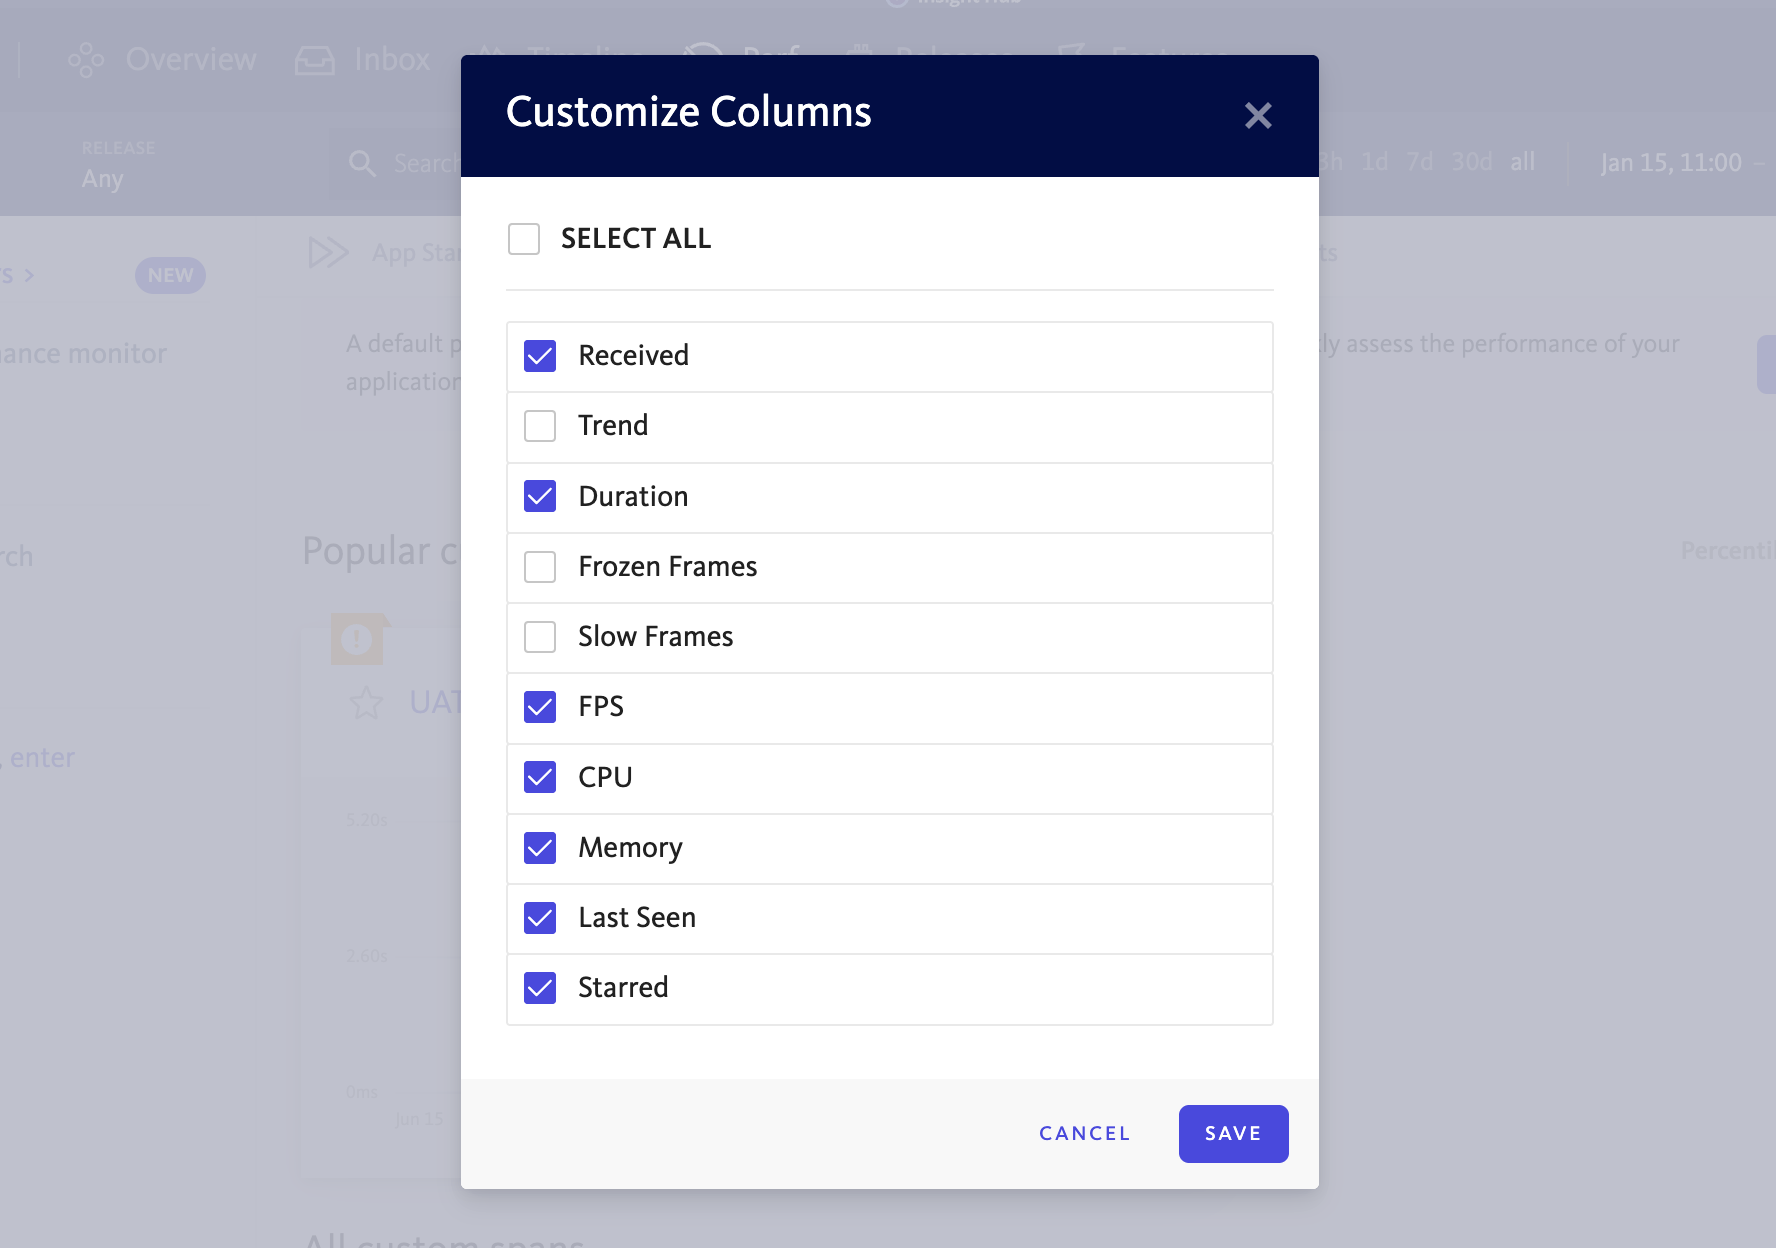
In a Unity app, the data columns are extended with the FPS data since this is often the core performance measurement used on this platform.
Slow and frozen frames are still available to help you understand the rendering performance in more detail and can be made visible using the Customize Columns button in the Span Groups table context menu (top-right):
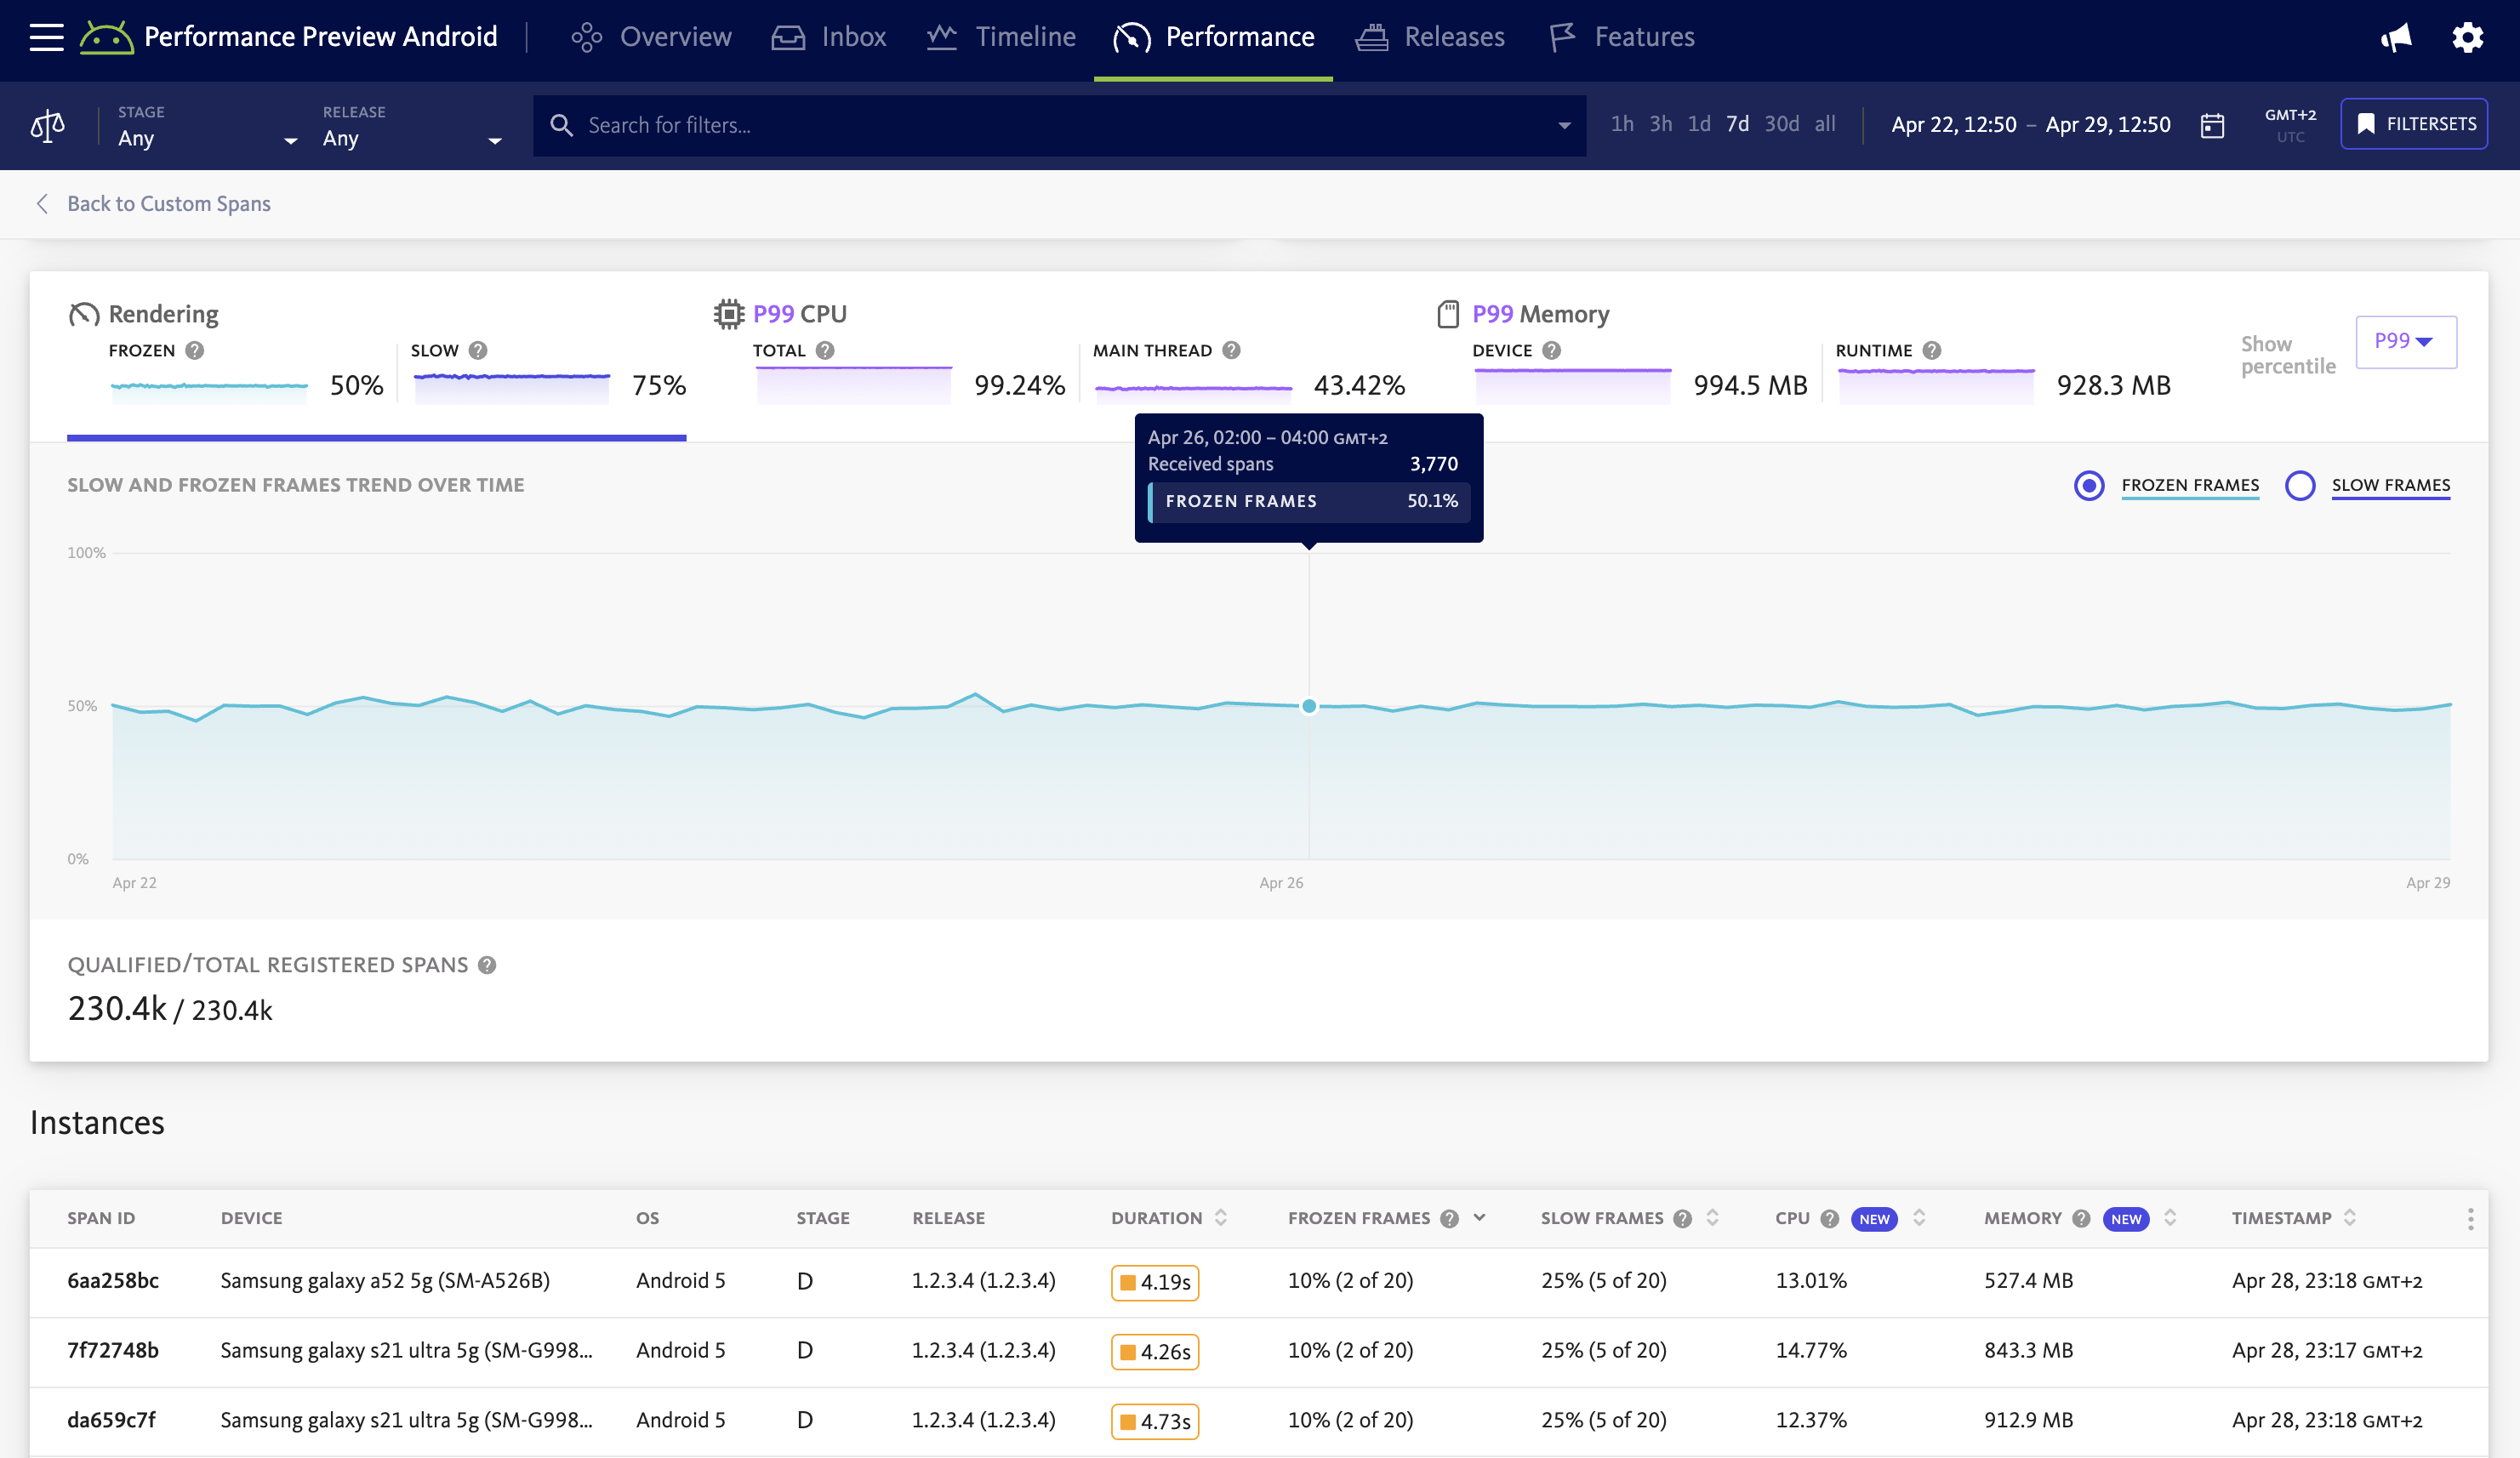
Understanding rendering issues
The Span Group Details page provides additional insights to the rendering data. The dedicated panel shows frame metrics distributed over time:
Comparison mode
To better understand the performance impact of visual changes or regressions, BugSnag provides a dedicated comparison mode.
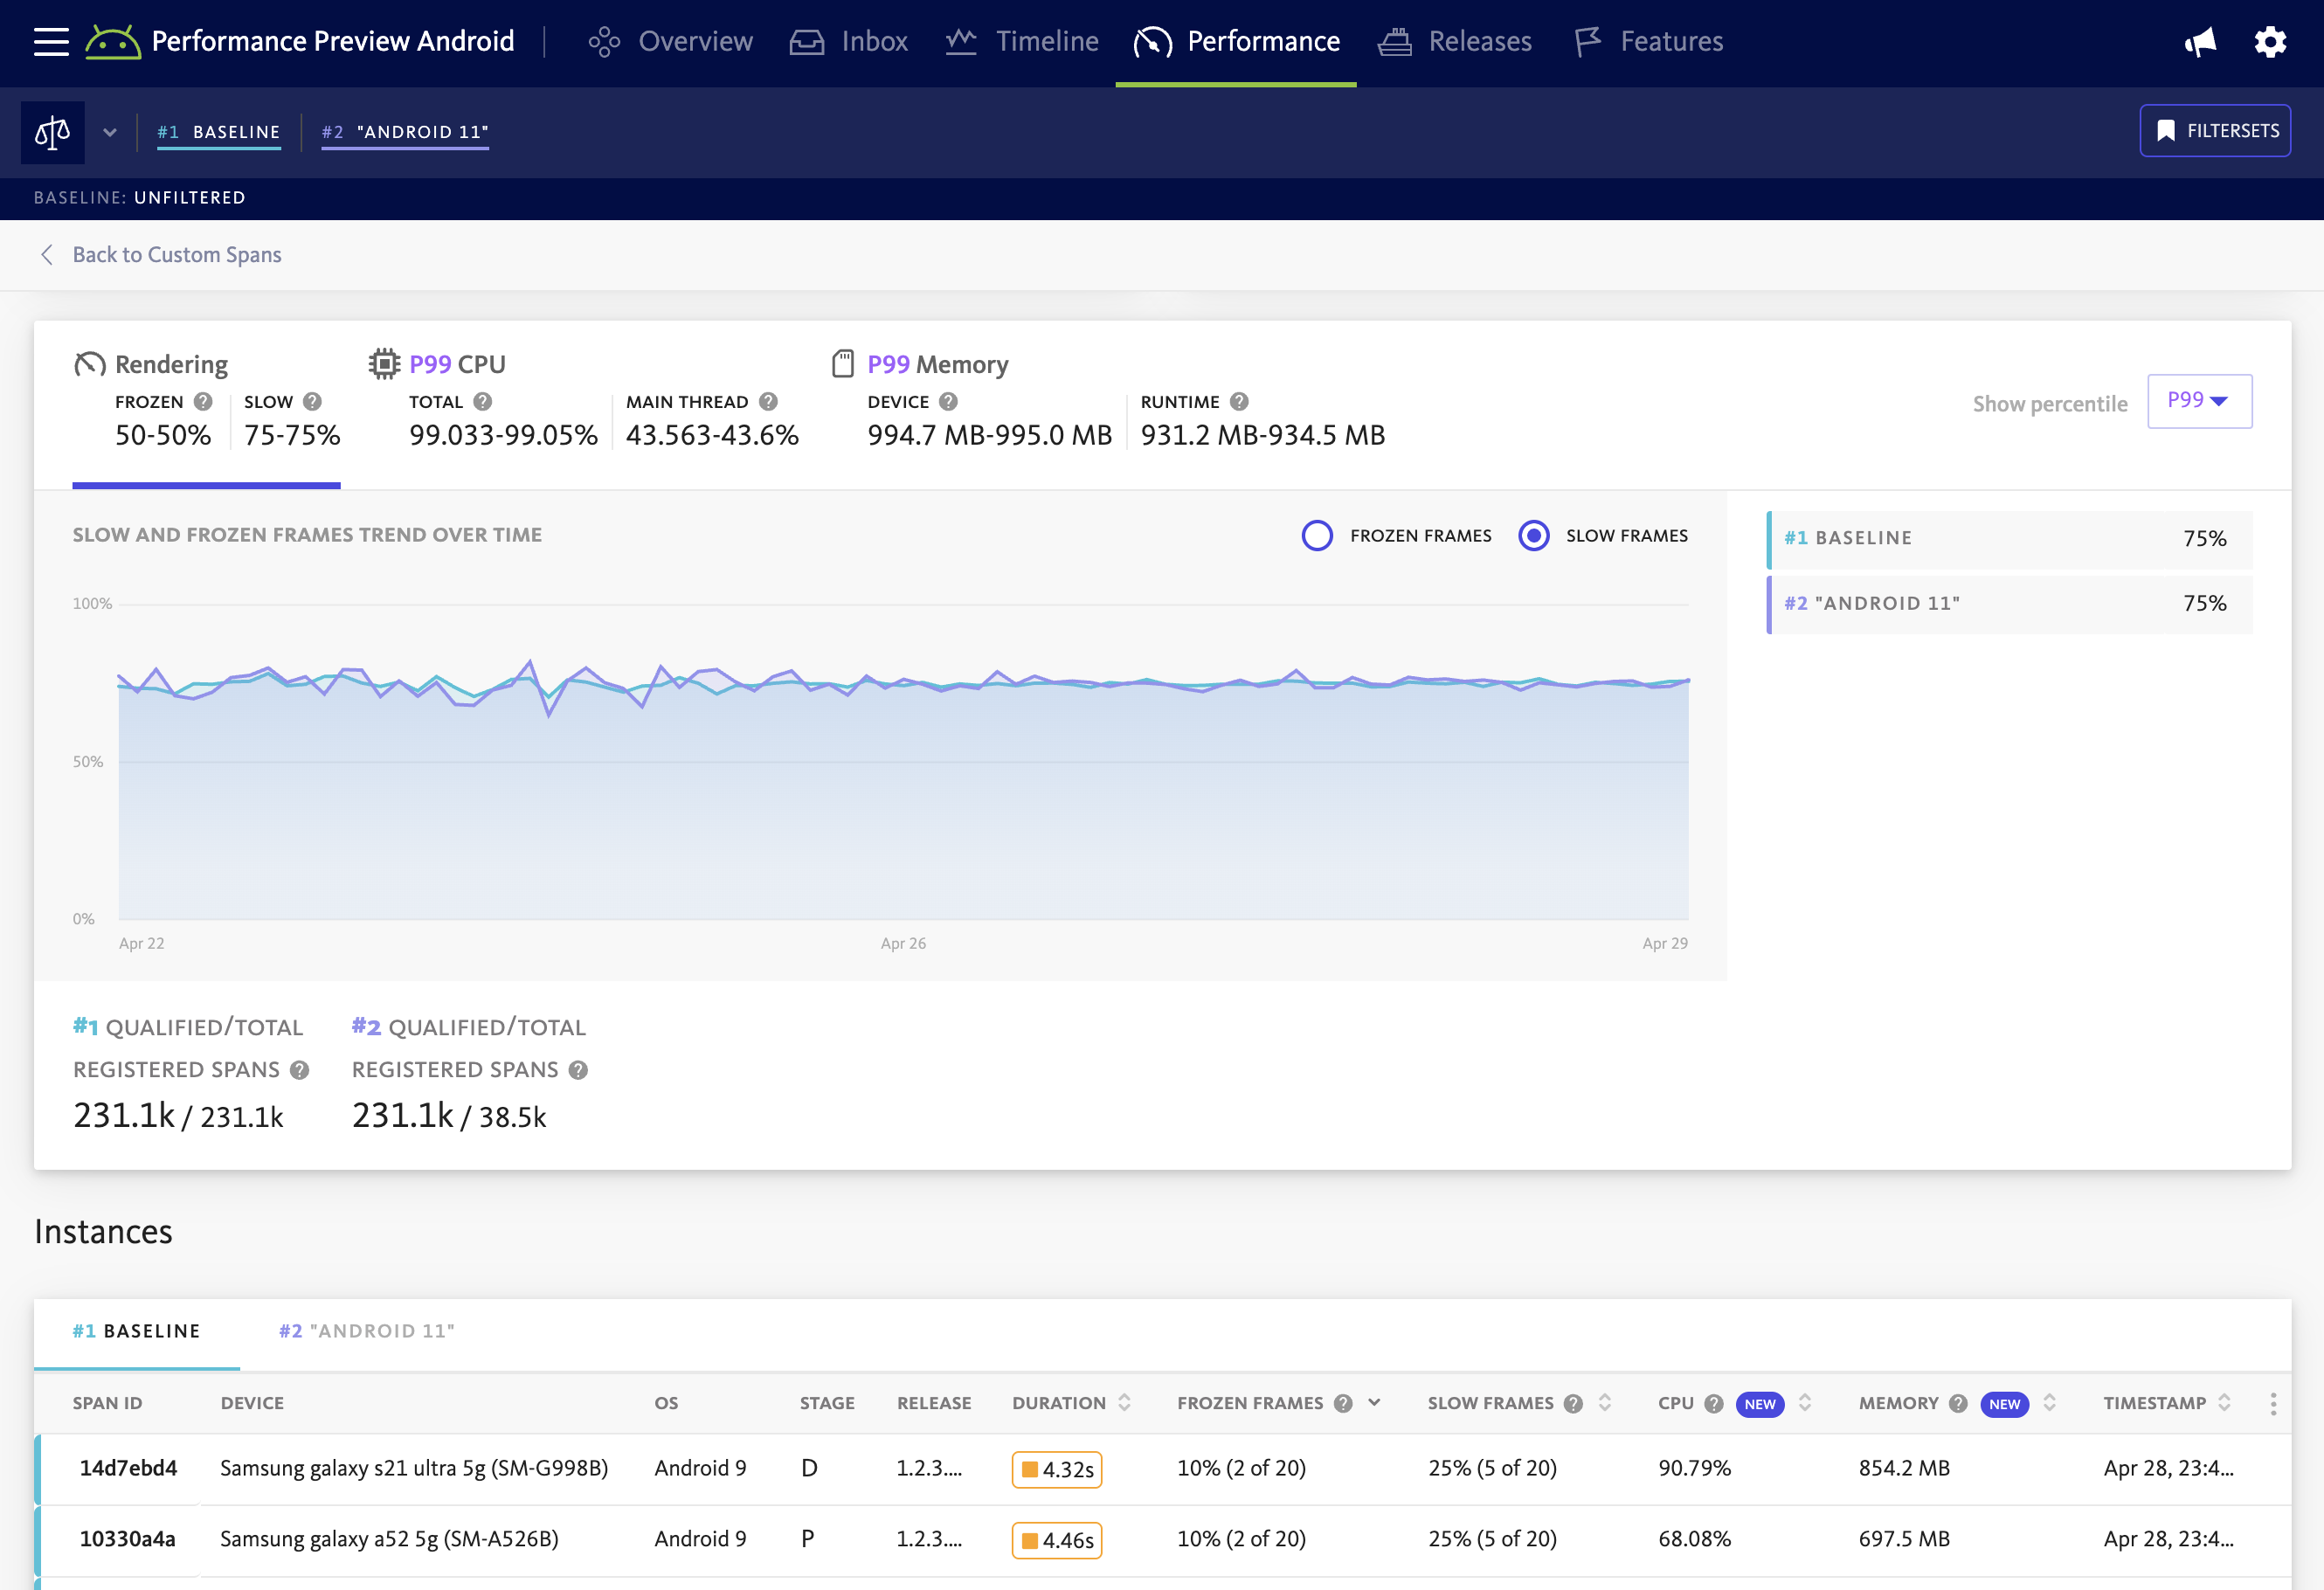
Enabling compare mode for rendering metrics enables detailed analysis of slow and frozen frames across key dimensions:
- App stages
- App releases
- Device models
- Operating system versions
This feature is especially useful when tracking how visual performance evolves between versions, such as identifying whether a UI redesign, animation, or newly introduced screen negatively affects frame rendering. By comparing metrics like frozen or slow frames between releases, developers can catch regressions early and isolate the source.
In the case of platform variability, rendering performance can vary significantly between devices or OS versions. Using comparison mode, you can pinpoint devices or configurations that consistently experience high frame rendering times—helping you optimize performance for affected user segments.
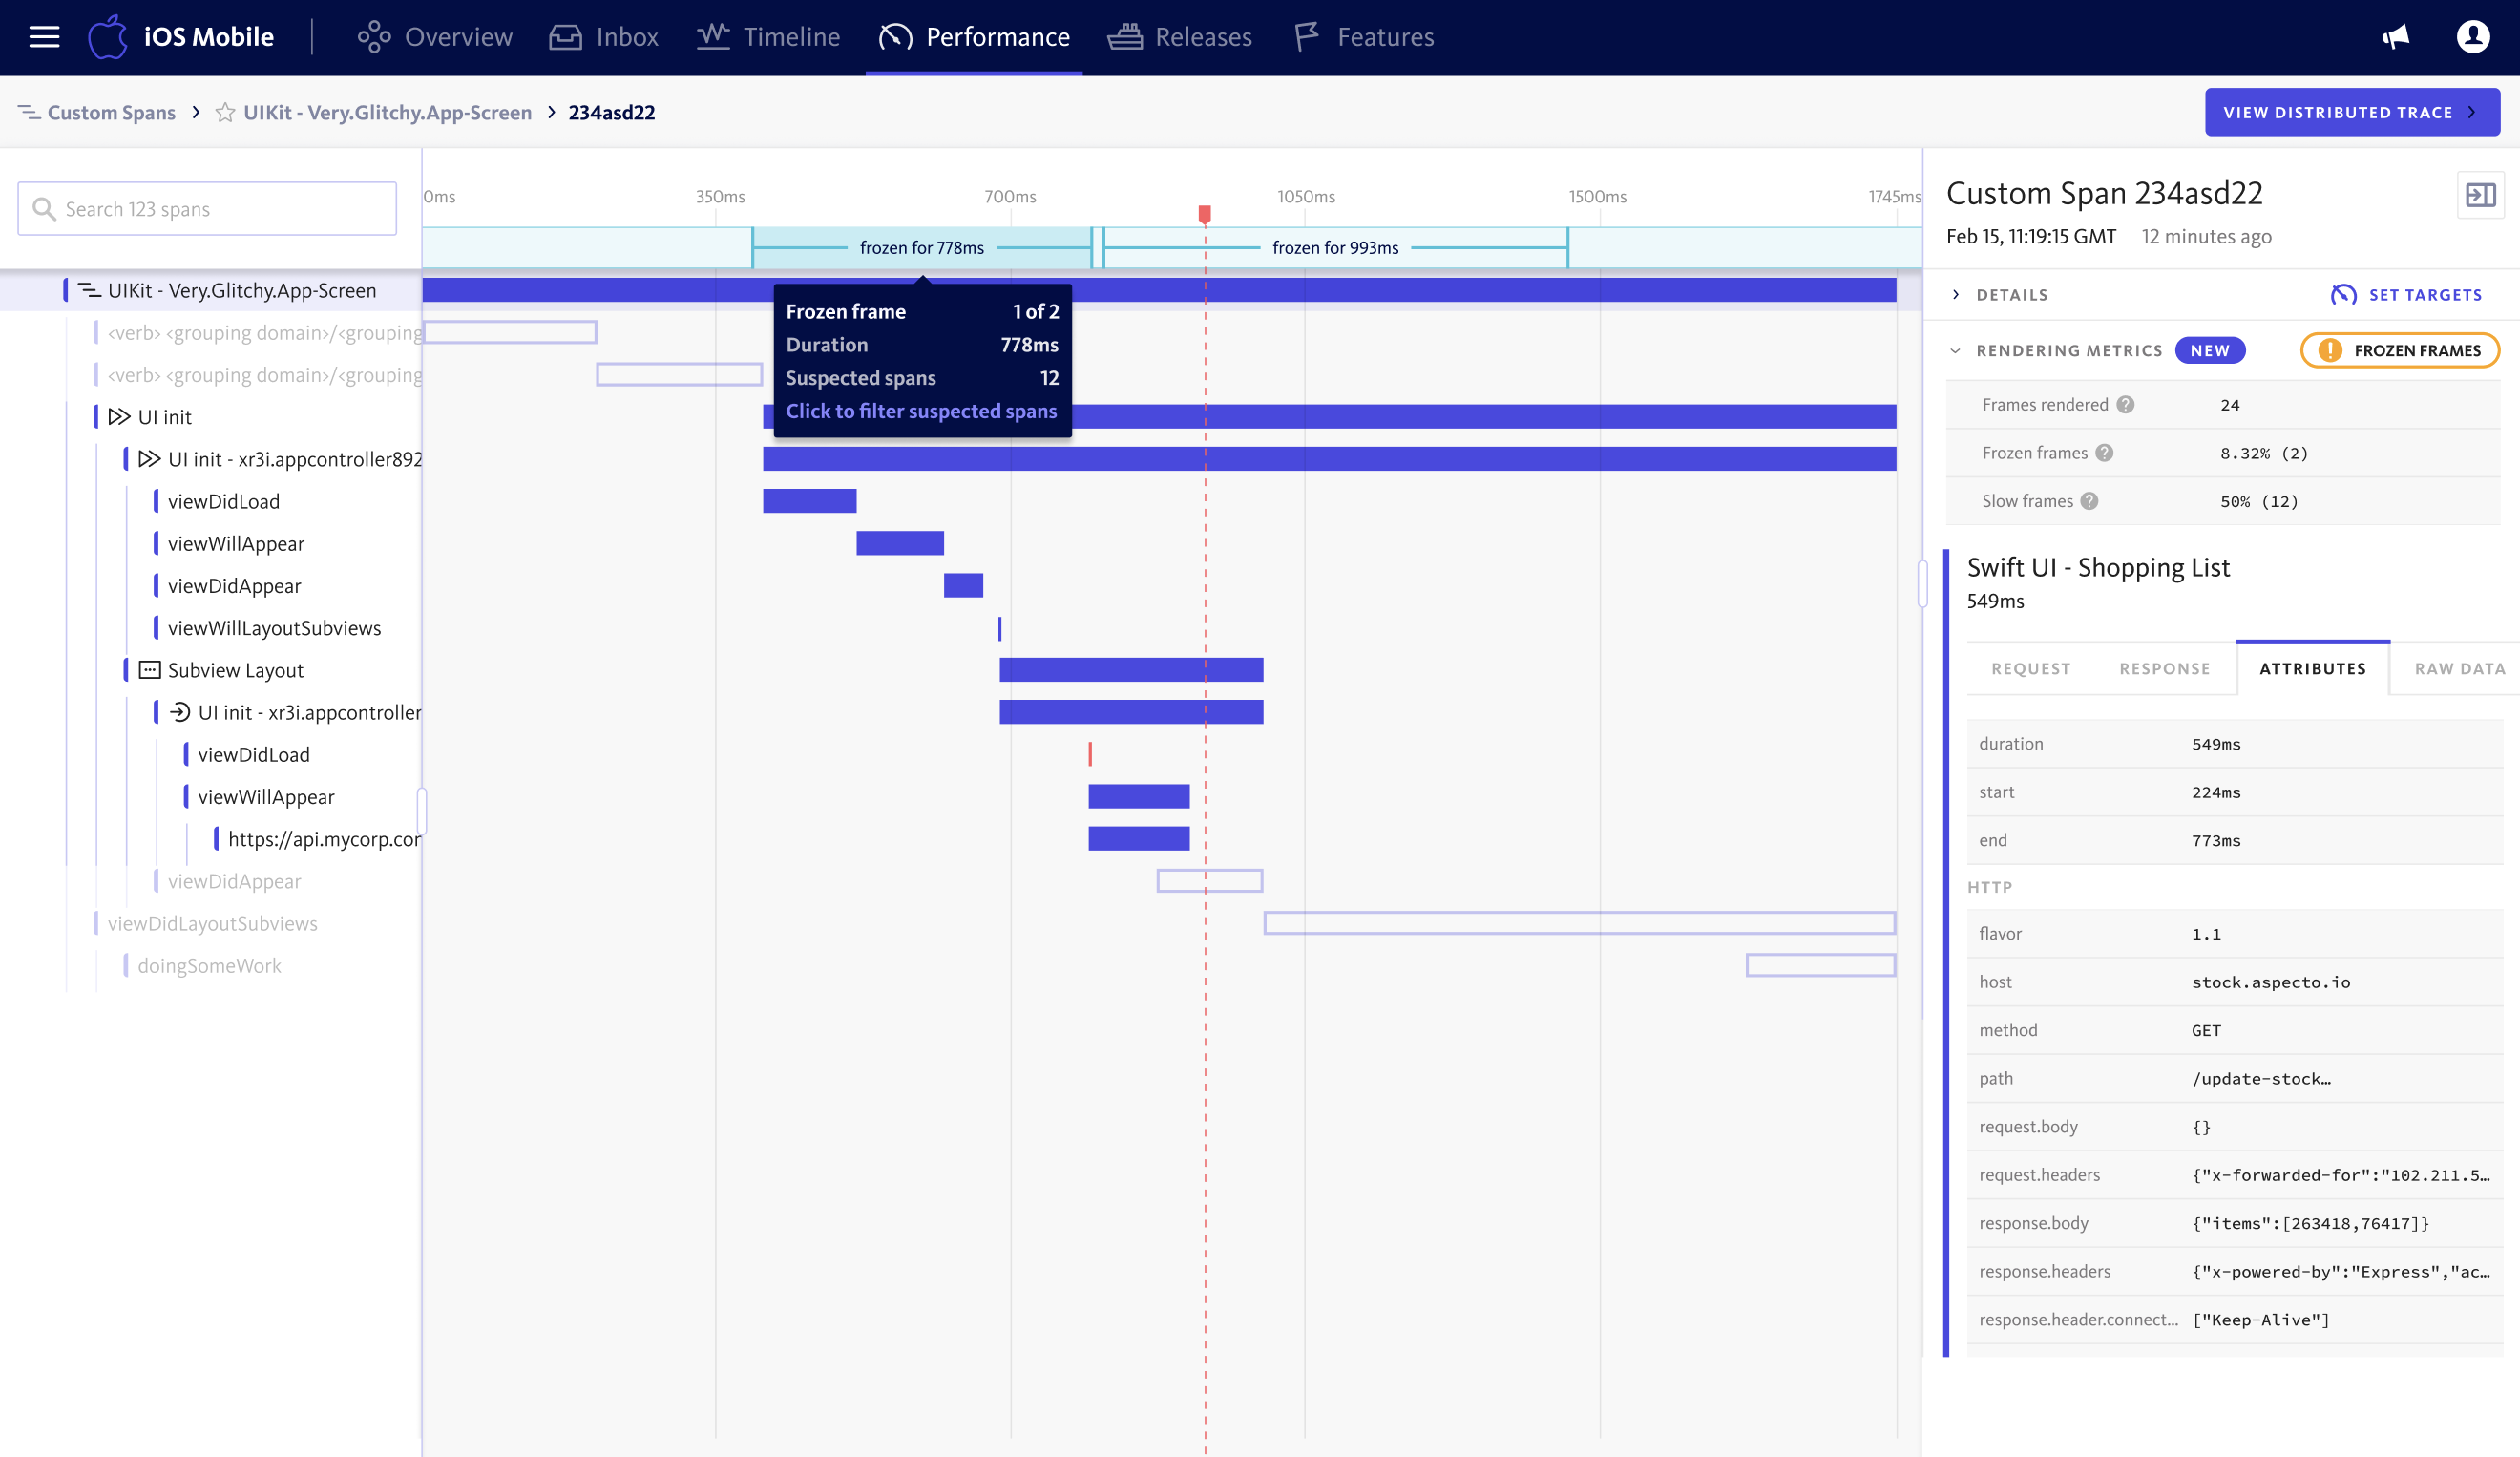
Investigating frozen frames
The table of span instances can be sorted to identify those that had poor rendering performance. Select a span to take you to a new page where you will see a detailed breakdown of that span’s performance, including a visualization of any frozen frames and their duration. Selecting a frozen frame from the top of the view will highlight suspected spans. Suspected spans are the operations that may be responsible for the frozen frames they intersect: