CPU usage
By monitoring CPU usage you can ensure your app is running efficiently, preventing slowdowns and maximizing performance.
The primary goal of the CPU analysis is to monitor the amount of load an app puts on the CPU of the device while it is operating. The relative average CPU utilization is a key metric for measuring this and can be captured with your spans for comparison over time and between releases to help identify action areas.
Capturing CPU usage
The BugSnag Performance SDKs can be configured to capture CPU usage. It is an opt-in feature that requires some initial configuration in your app. Full instructions can be found in the platform-specific documentation:
Spotting CPU-intensive operations
Finding the areas of your app with a high CPU-load is valuable in improving its performance. CPU measurements collected in the app are aggregated and shown as an additional column on the Span Group page of the dashboard.
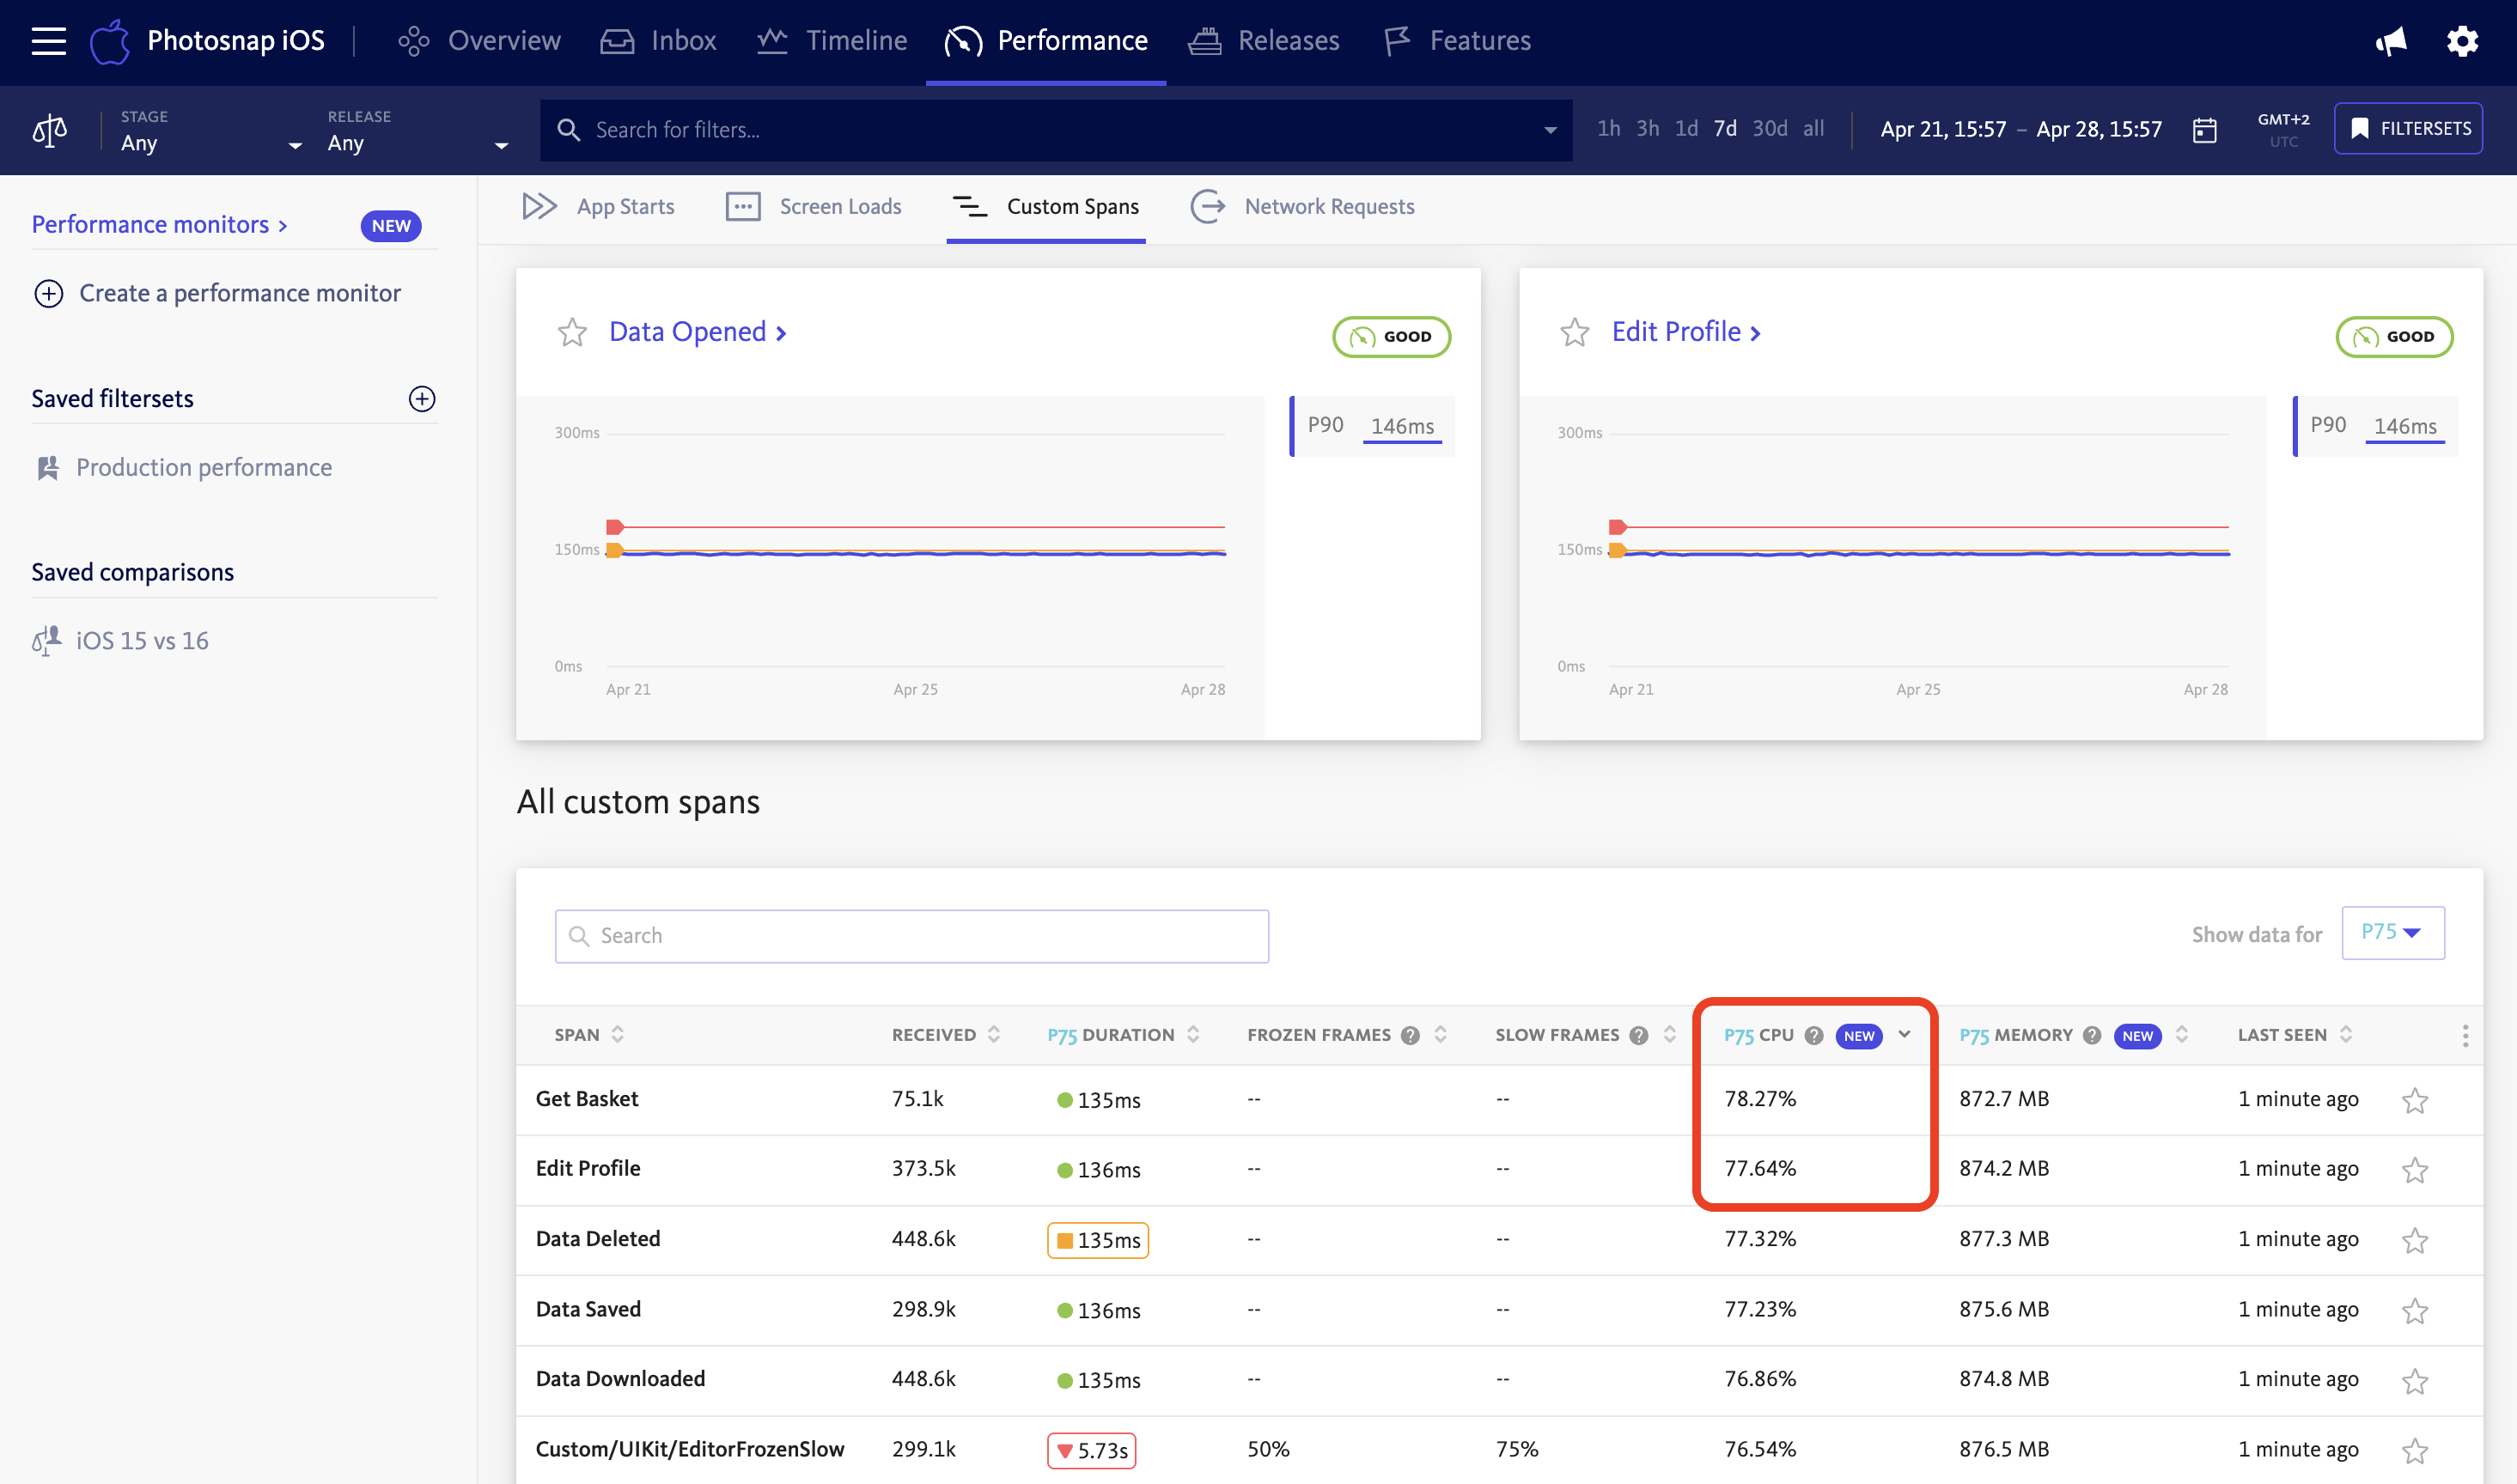
The CPU column helps you better understand how much processor is being used by various app components. By ordering the data by this column, you can identify the areas of your app that utilize the most CPU and that would be primary targets for additional research.
Analyzing CPU usage over time and releases
By selecting a span group, you can see a further graph showing aggregated CPU usage distributed over time for the whole app and also for just the main thread:
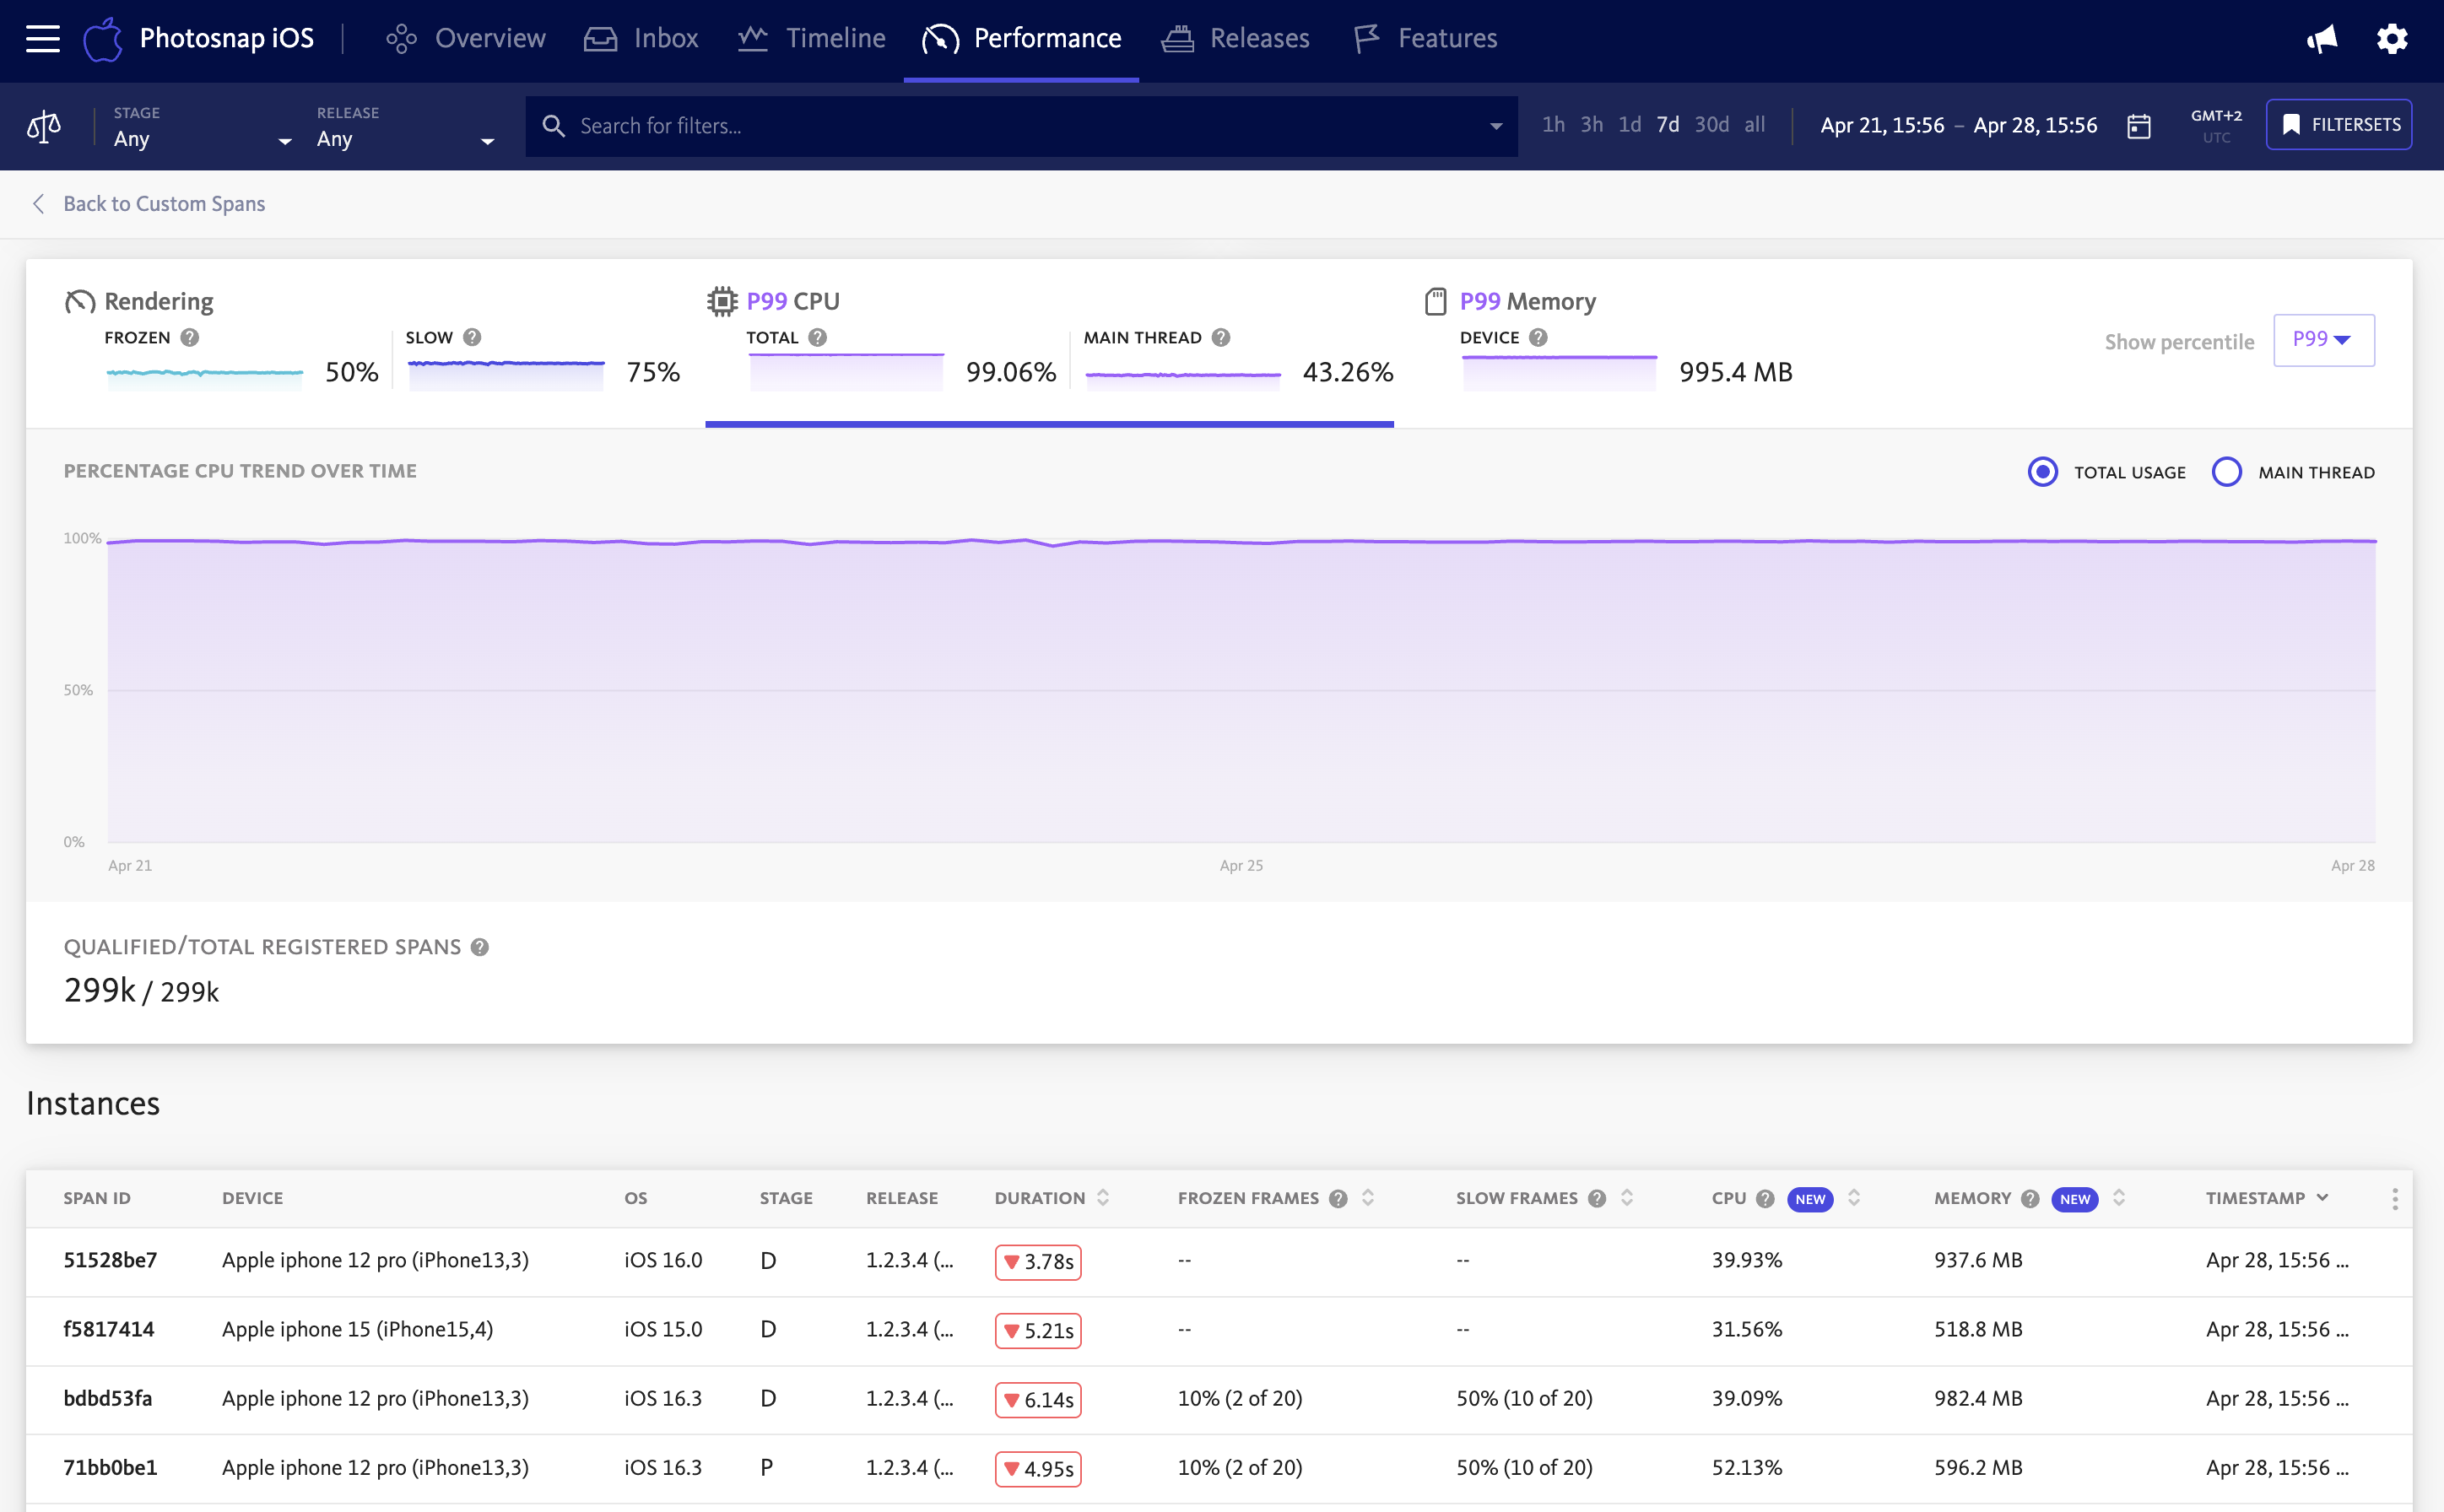
To provide even more detailed data, each span instance is presented in the Instances table with its CPU data.
By examining various time periods, the CPU graph makes it possible to identify both long-term patterns and recent deviations. As with other performance metrics, the data can also be filtered to include or exclude data outliers using the Percentile control.
Comparison mode
The comparison controls on the dashboard allow teams to see how CPU load varies across different dimensions:
- App stages
- App releases
- Device models
- Operating system versions
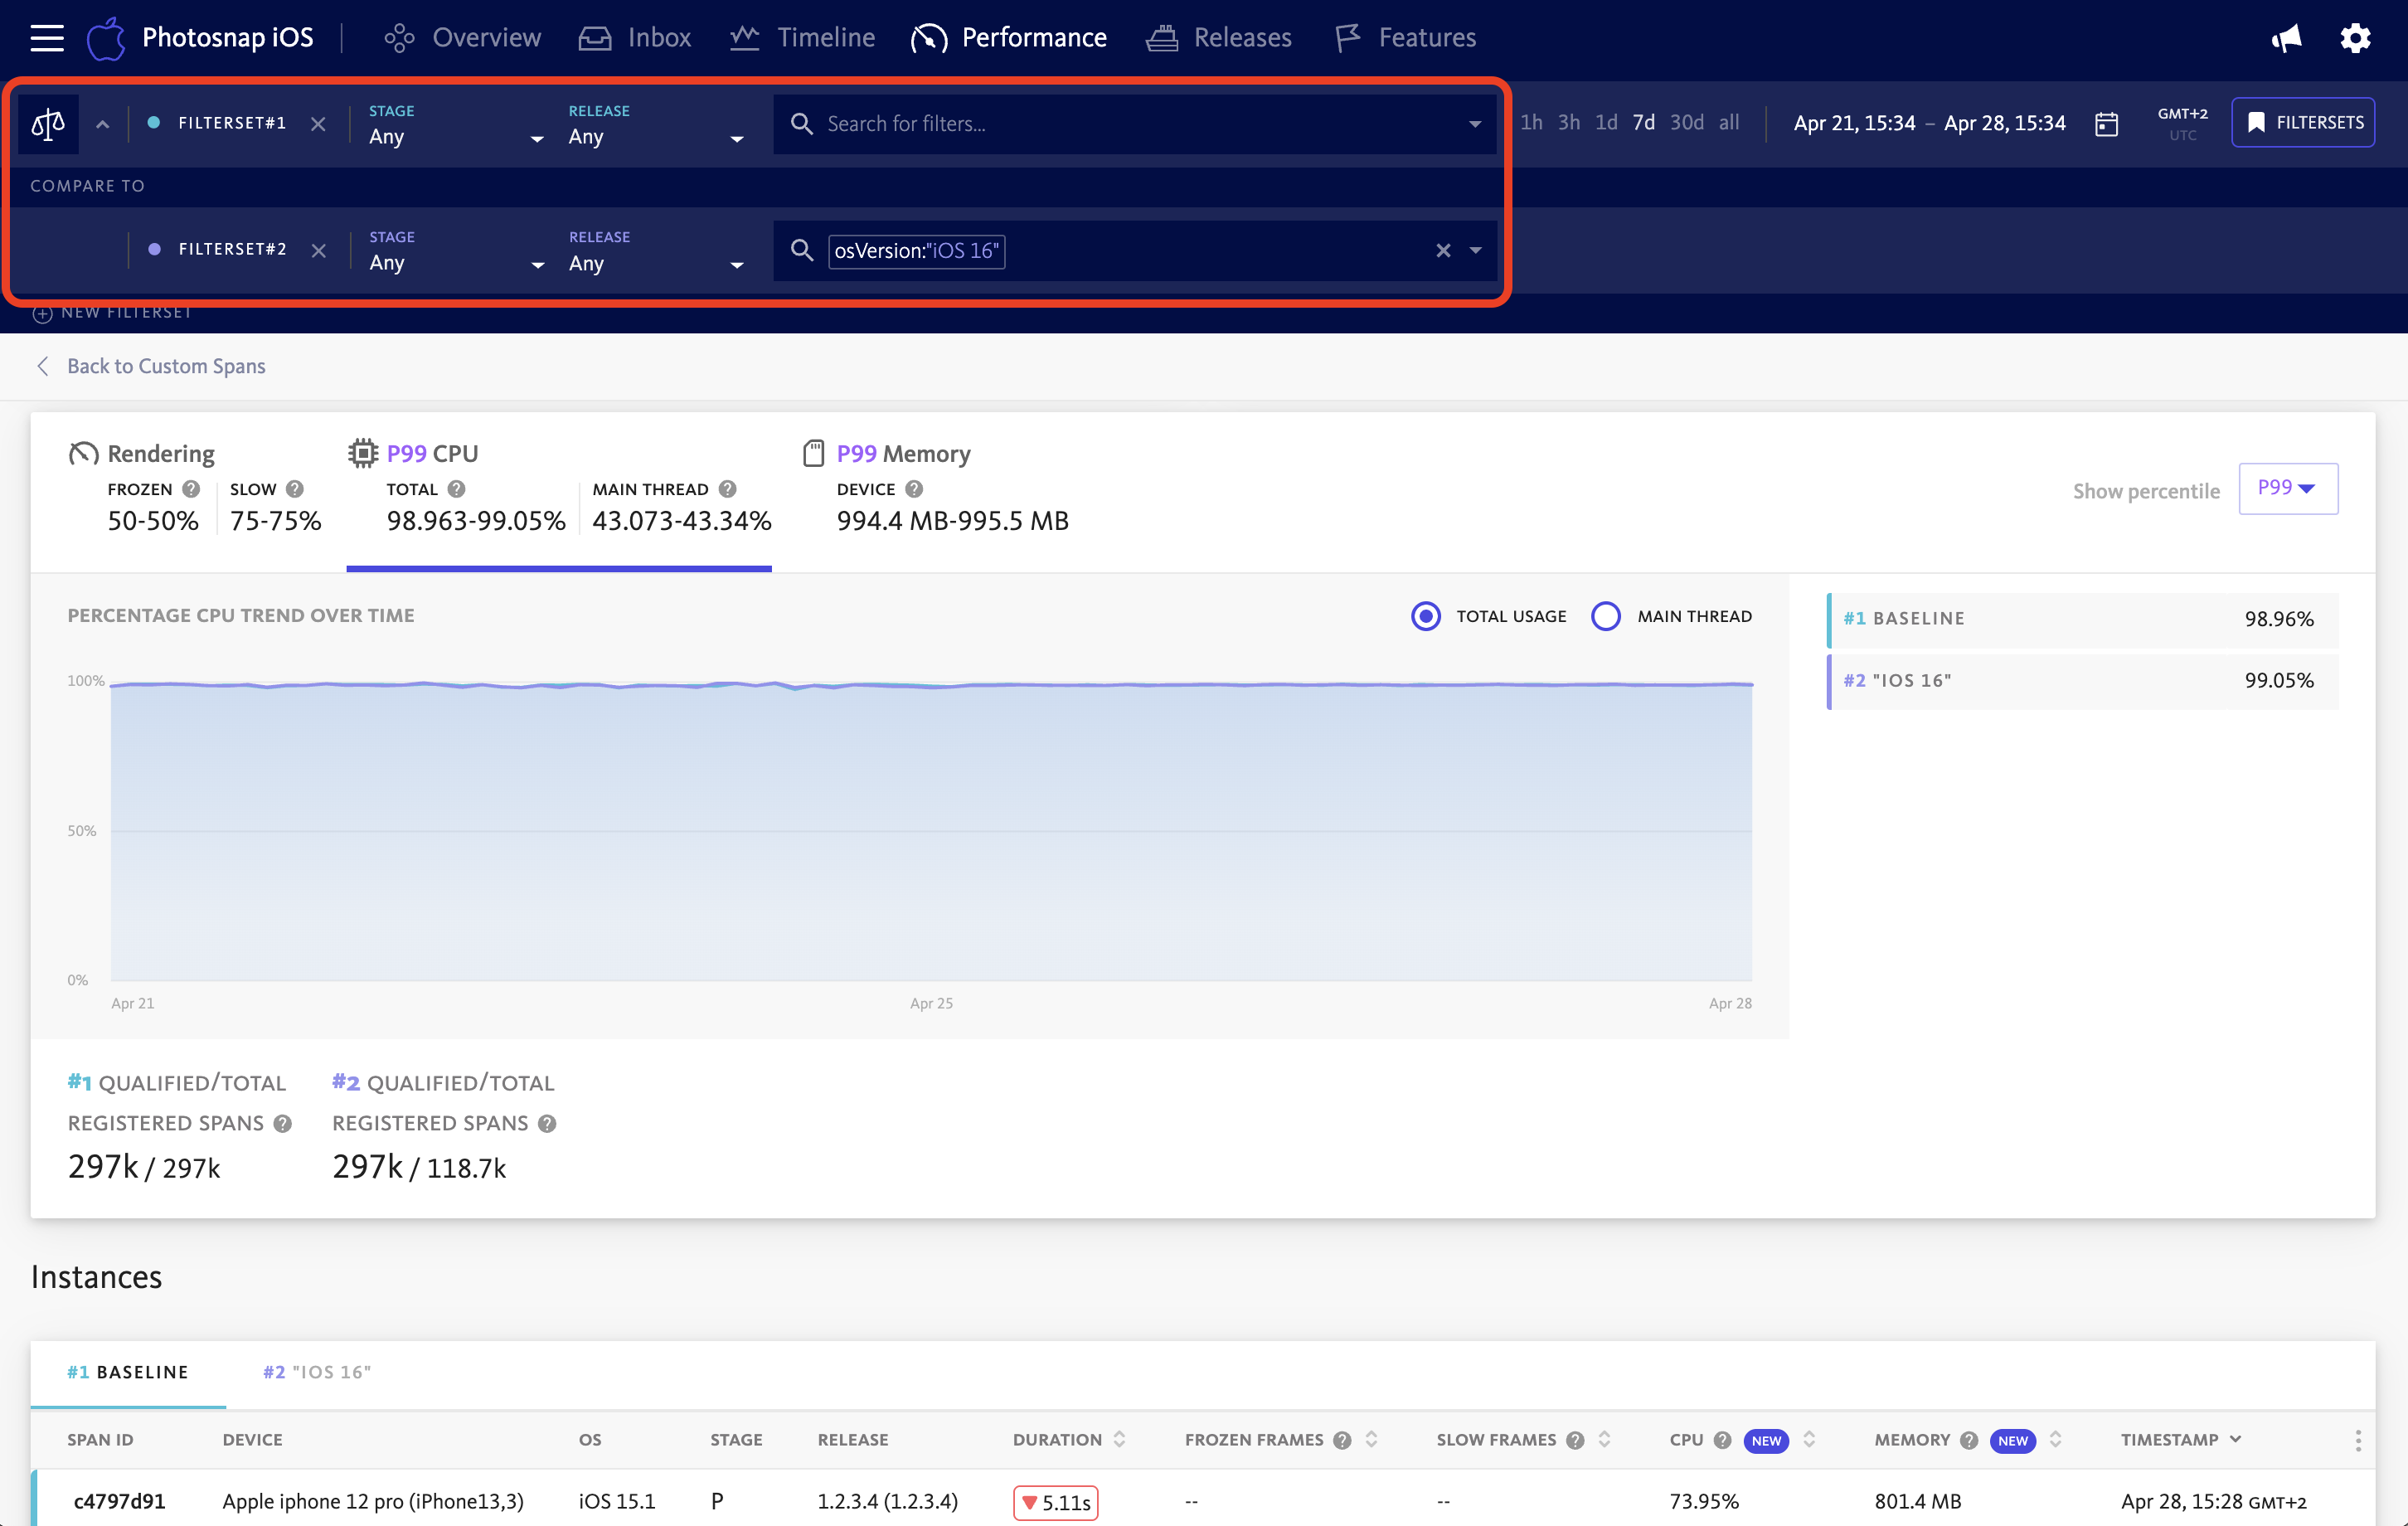
This comparison functionality powered by Custom Filters helps you detect performance regressions introduced in recent updates by highlighting changes in average CPU utilization. For instance, an increased CPU load in the latest release may indicate inefficient algorithms, unoptimized loops, or unintended background processing introduced by new features.
By comparing CPU usage across device models, you can also spot performance bottlenecks that may disproportionately affect lower-tier or older devices. Similarly, identifying OS-specific anomalies helps address issues tied to system-level differences in scheduling or power management.