Memory consumption
Tracking memory consumption helps prevent leaks and optimize usage, keeping your app stable and responsive.
There are several tools available to mobile developers for identifying memory leaks, including Xcode Instruments and the Android Studio Memory Profiler. For analysis during development, these tools are helpful in profiling the memory consumption of your app.
However it is challenging to anticipate every edge-case situation because the app is running on a variety of devices under various conditions in the real world. Because of this, BugSnag captures memory usage in addition to other runtime performance indicators like CPU or Rendering, enabling you to seek further user experience improvements.
Production data covering actual memory consumption over a wide variety of devices also enables you to monitor changes over time or across different releases. The memory footprint of a specific operation or even feature can be measured and contrasted with an earlier versions of the application. Larger memory usage in a new release is an indicator of a regression or memory leak.
Monitoring memory usage helps you make sure a significant code change or large and complex feature does not bring any regressions in terms of memory usage. This is especially important if the feature includes native C/C++ code which has a higher chance of introducing memory leaks.
Capturing memory consumption
The BugSnag Performance SDKs can be configured to capture Memory consumption. It is an opt-in feature that requires some initial configuration in your app. Full instructions can be found in the platform-specific documentation:
We currently support capturing of Memory consumption for custom spans only. Support for automatic capture of screen loads and for other span types is coming soon.
Spotting high memory usage and regressions
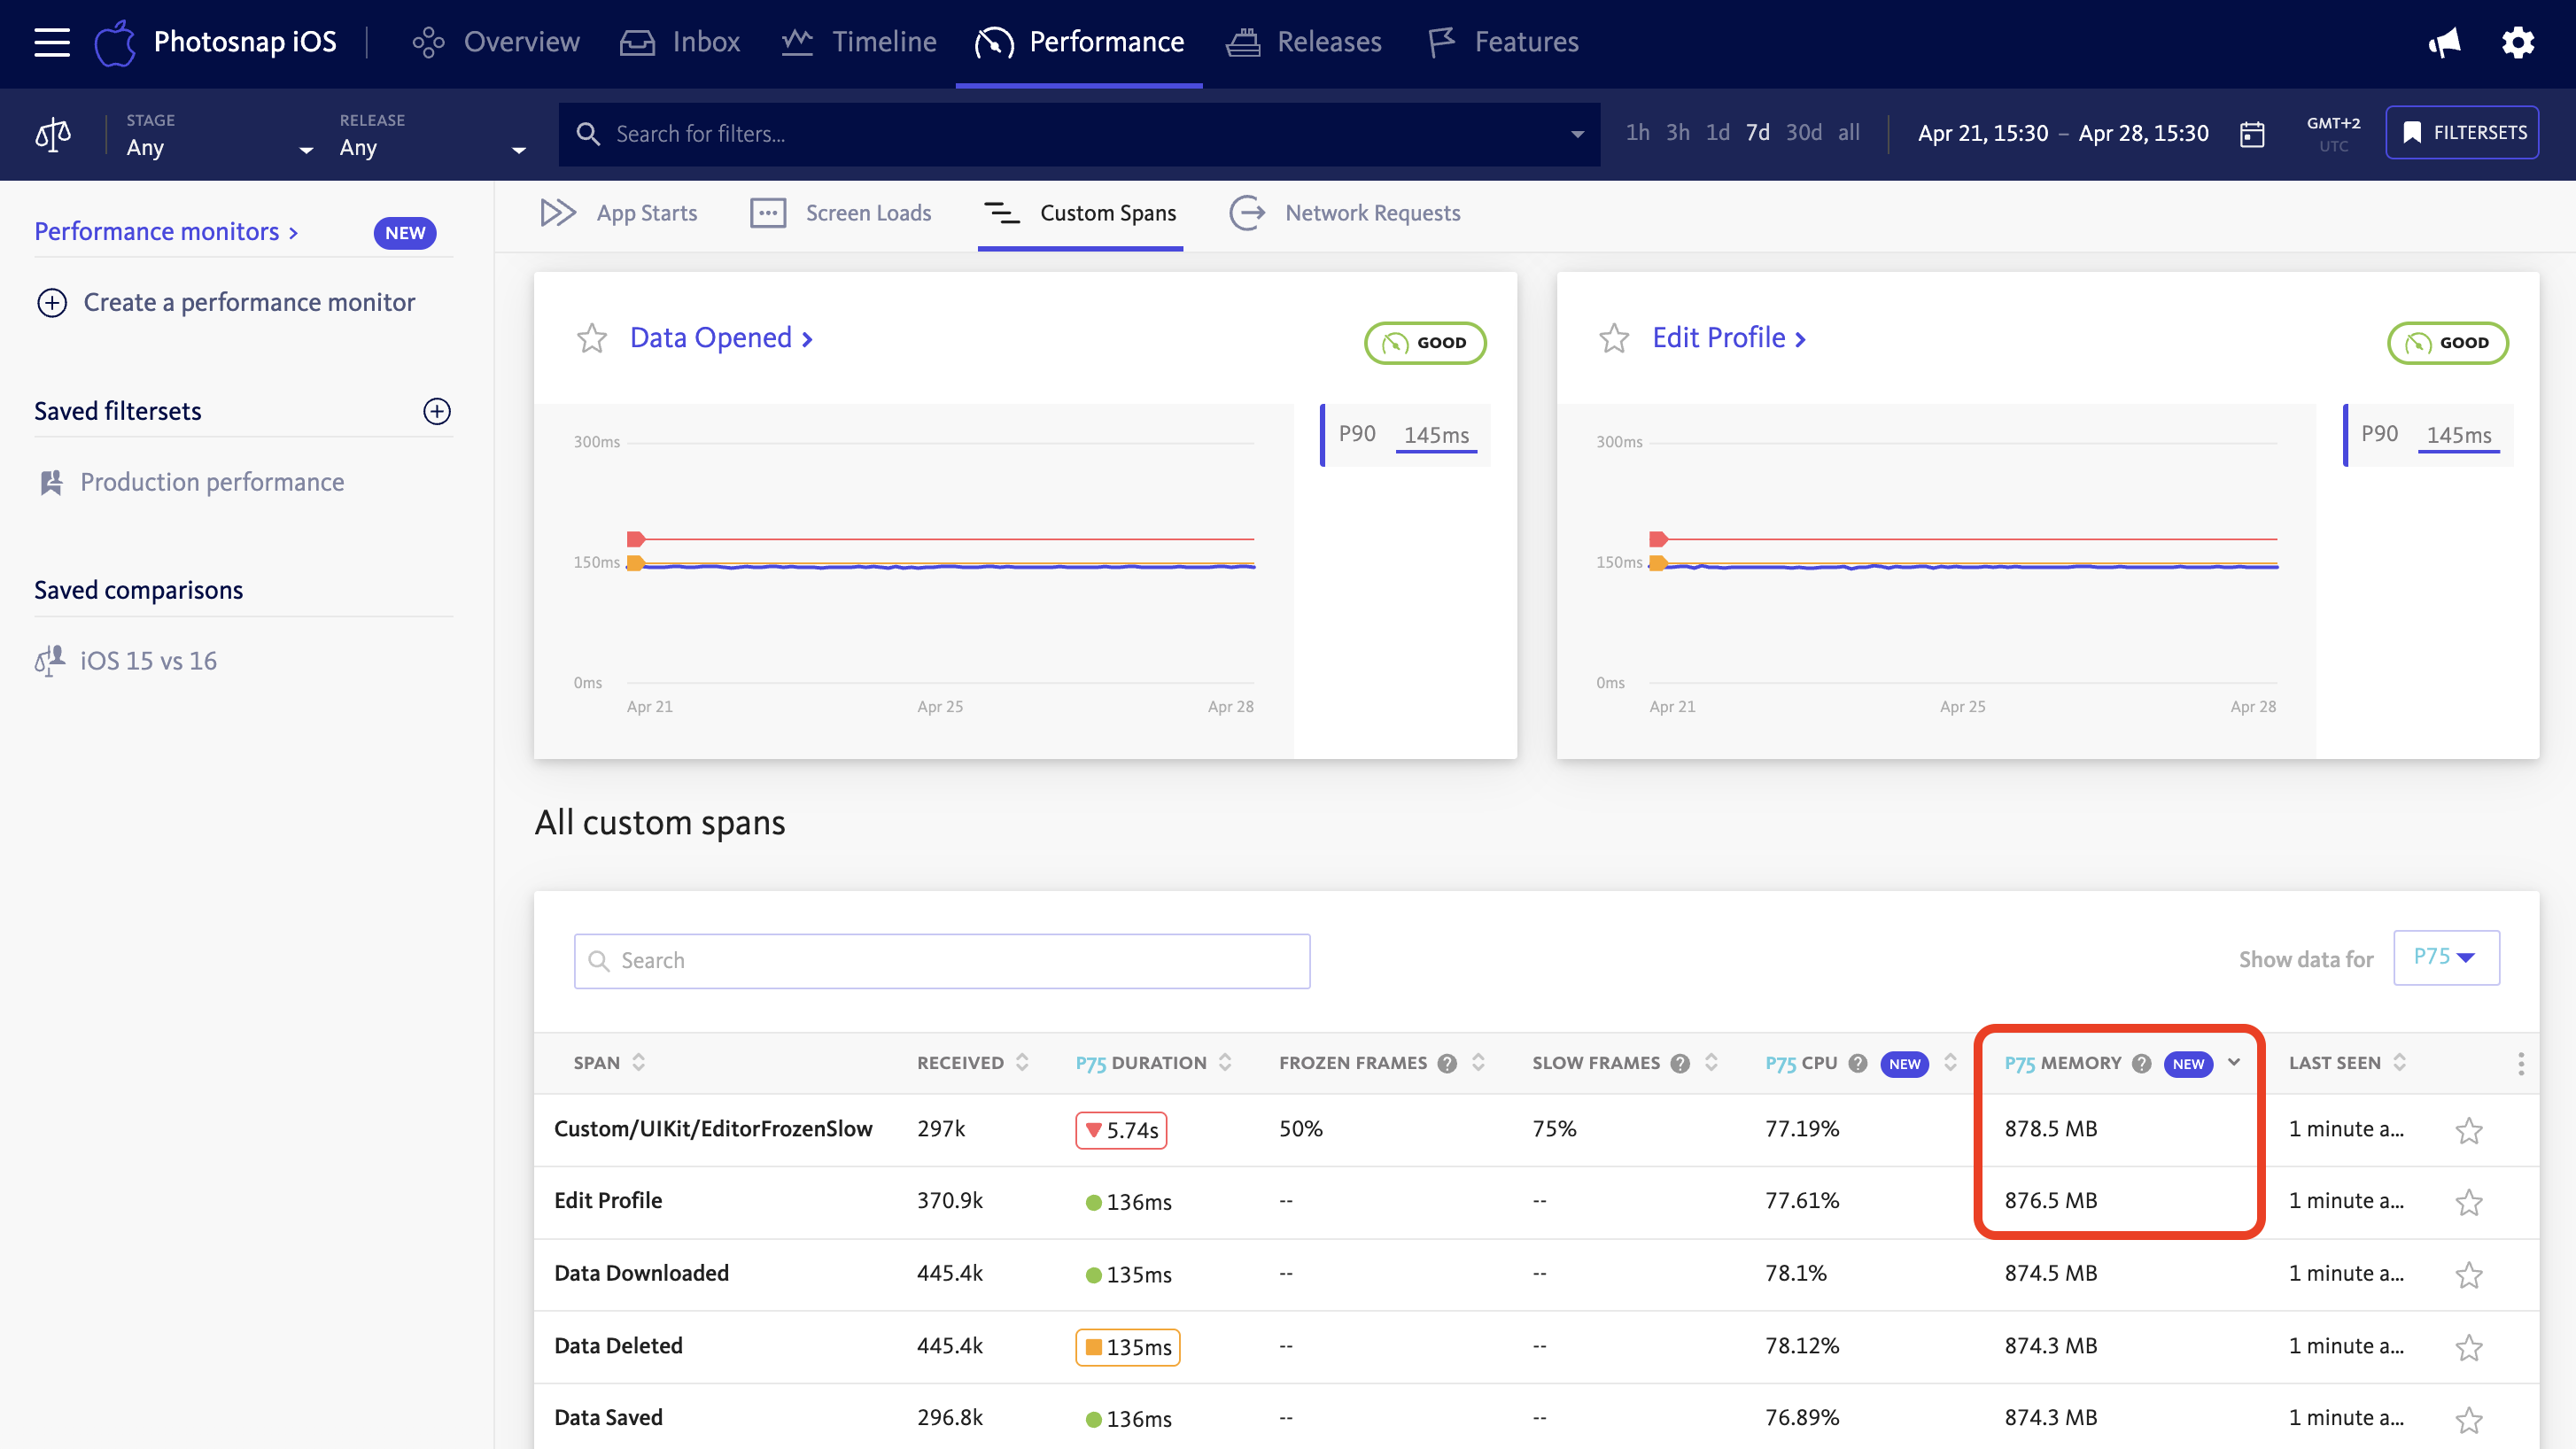
The best place to start searching for memory problems is with aggregated data information at the span group level. Each custom span group’s memory measurements, gathered by the BugSnag SDK and aggregated in the dashboard, are displayed in a separate columns along with the percentile value and the most recent trend.

The Memory column helps you better understand how much memory is being used by various app components. It can be sorted to identify the areas of the application that utilize the most memory and are excellent targets for additional research.
Analyzing memory consumption over time and releases
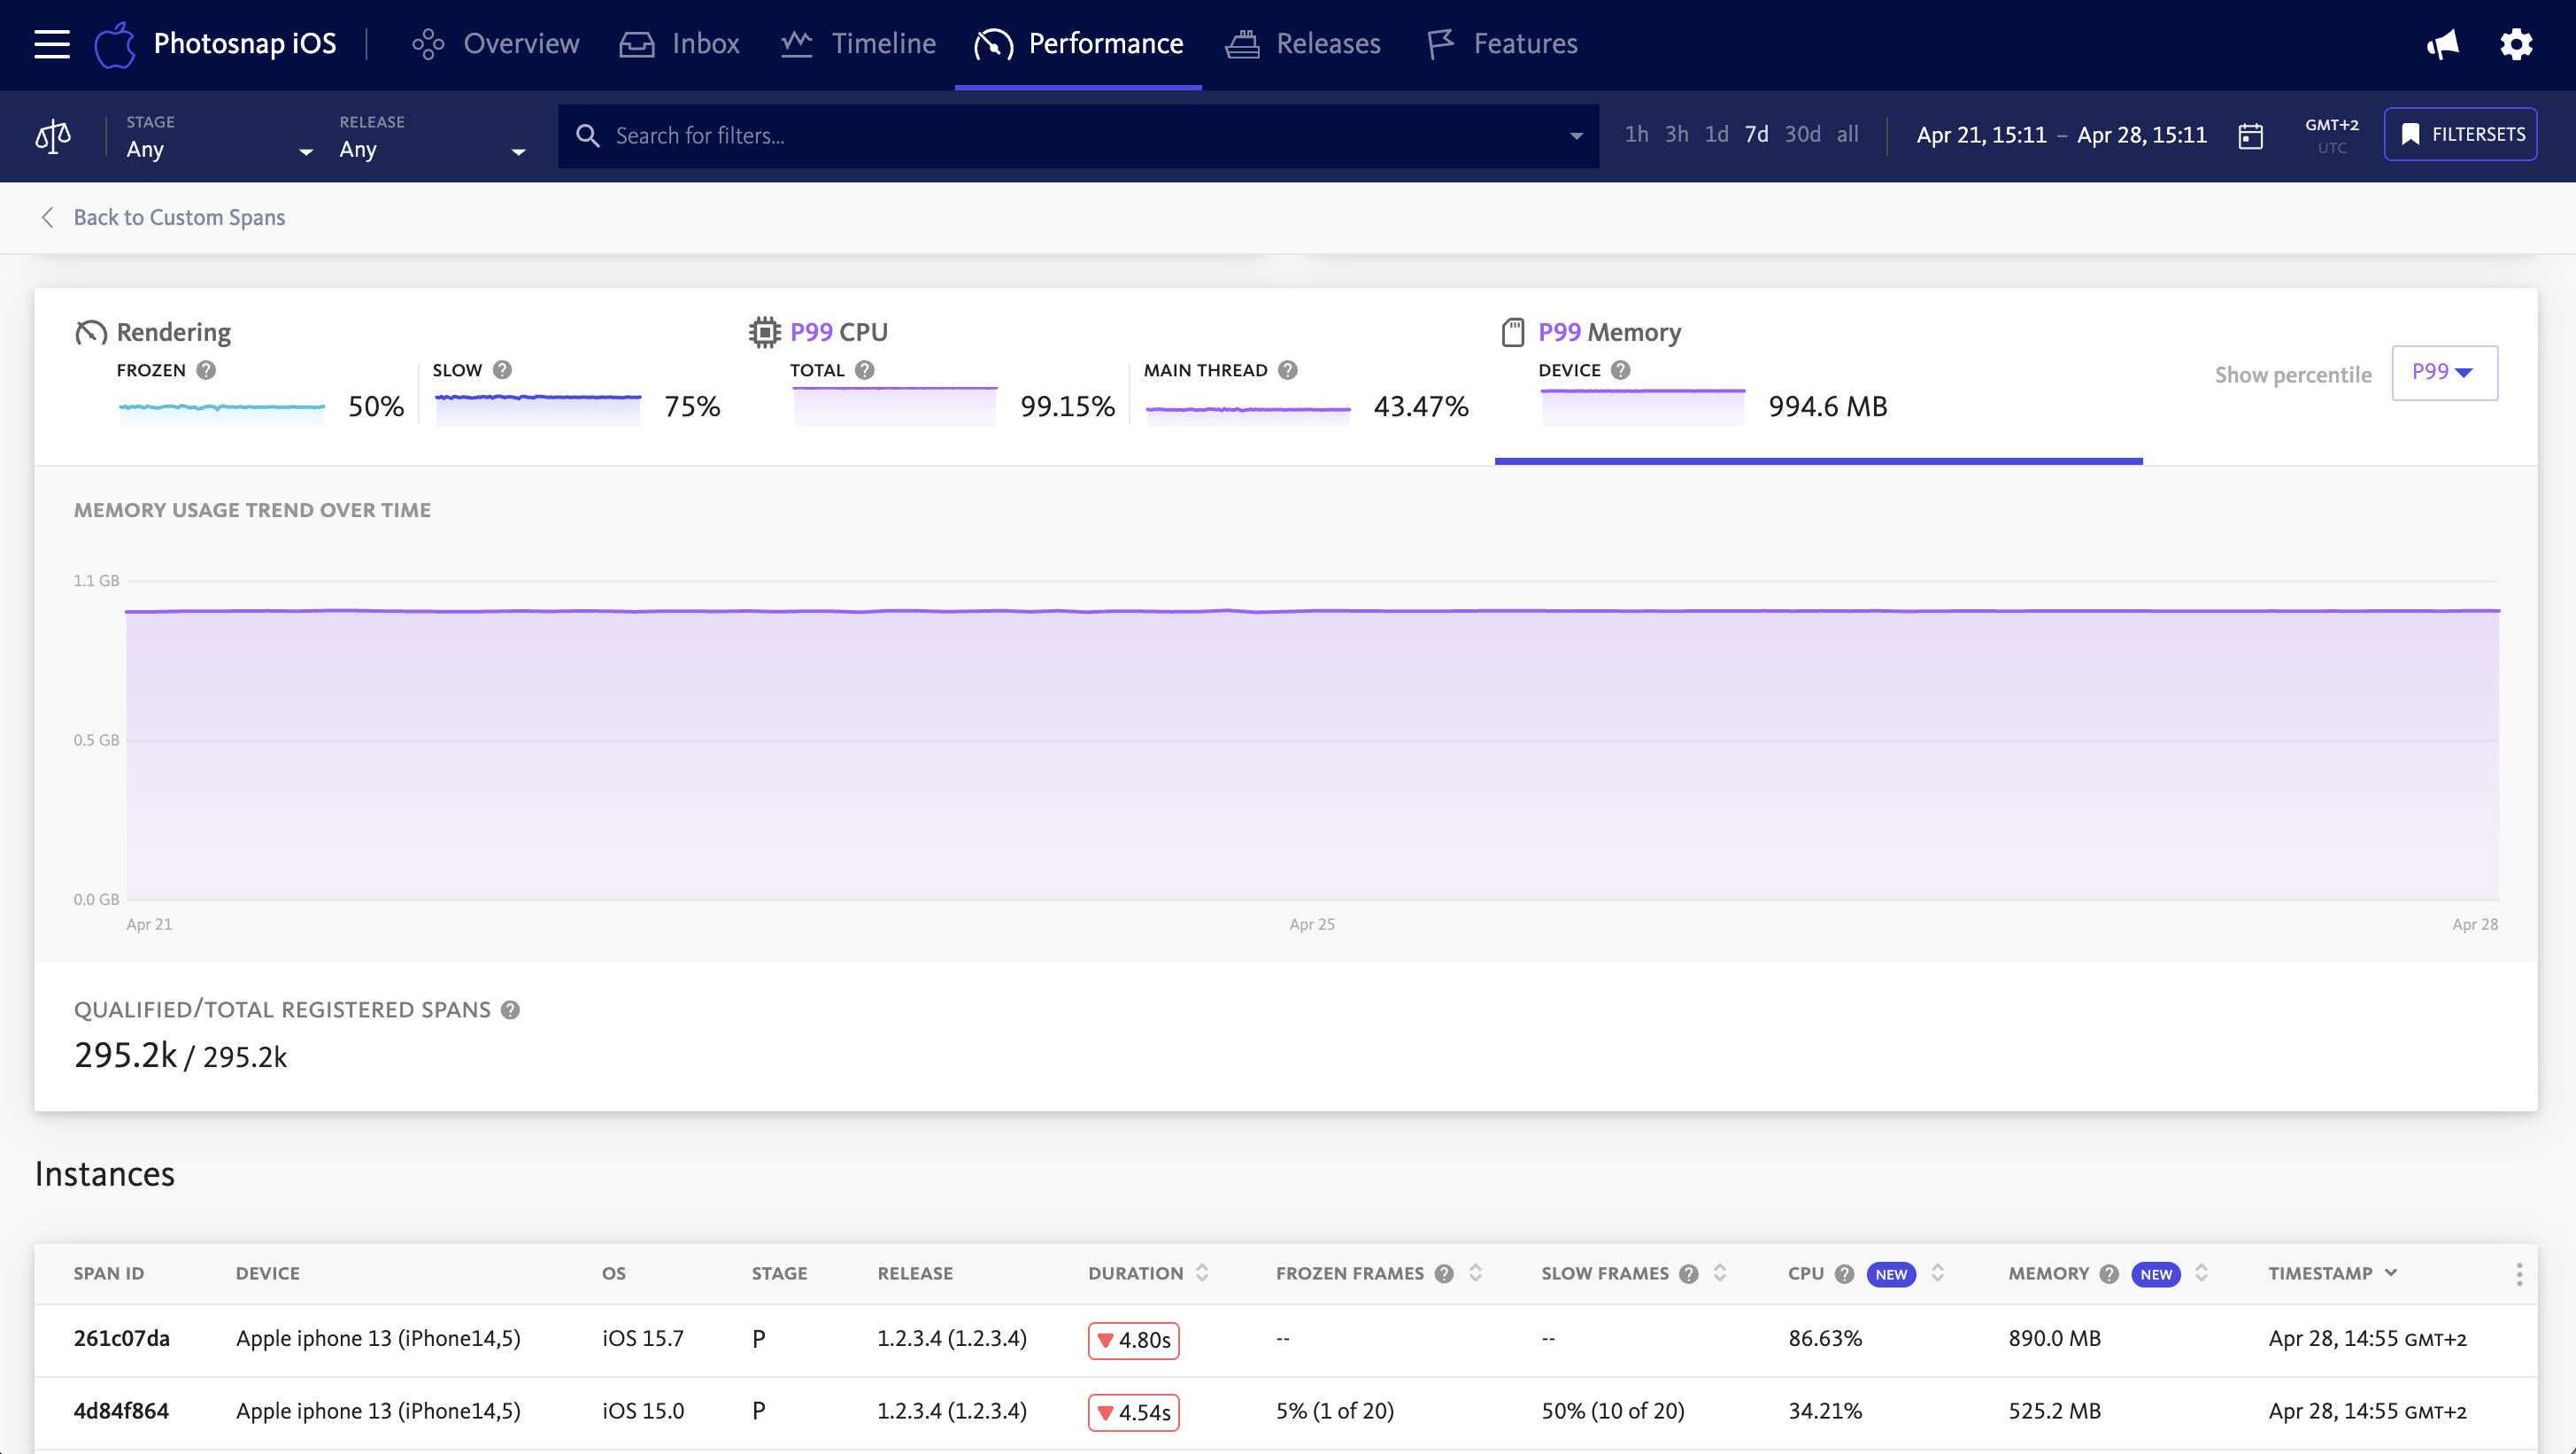
Further memory analysis can be carried out by examining how the amount of consumption changed over time and across many releases after accessing a specific Span Group.

By examining various time periods, the memory graph makes it possible to identify both long-term patterns and recent deviations. In addition to the base device memory values, various platforms may report supplementary memory metrics. For instance, applications running on Android often include Android Runtime Heap memory allocations in their reports.
The percentile chosen for the analysis is the basis for the values that are displayed, which aid in understanding the impact of the memory change across different user groups. You can identify niche memory leaks on the smaller range of devices by using values like P99 to comprehend the bigger context of P75.
Comparison mode
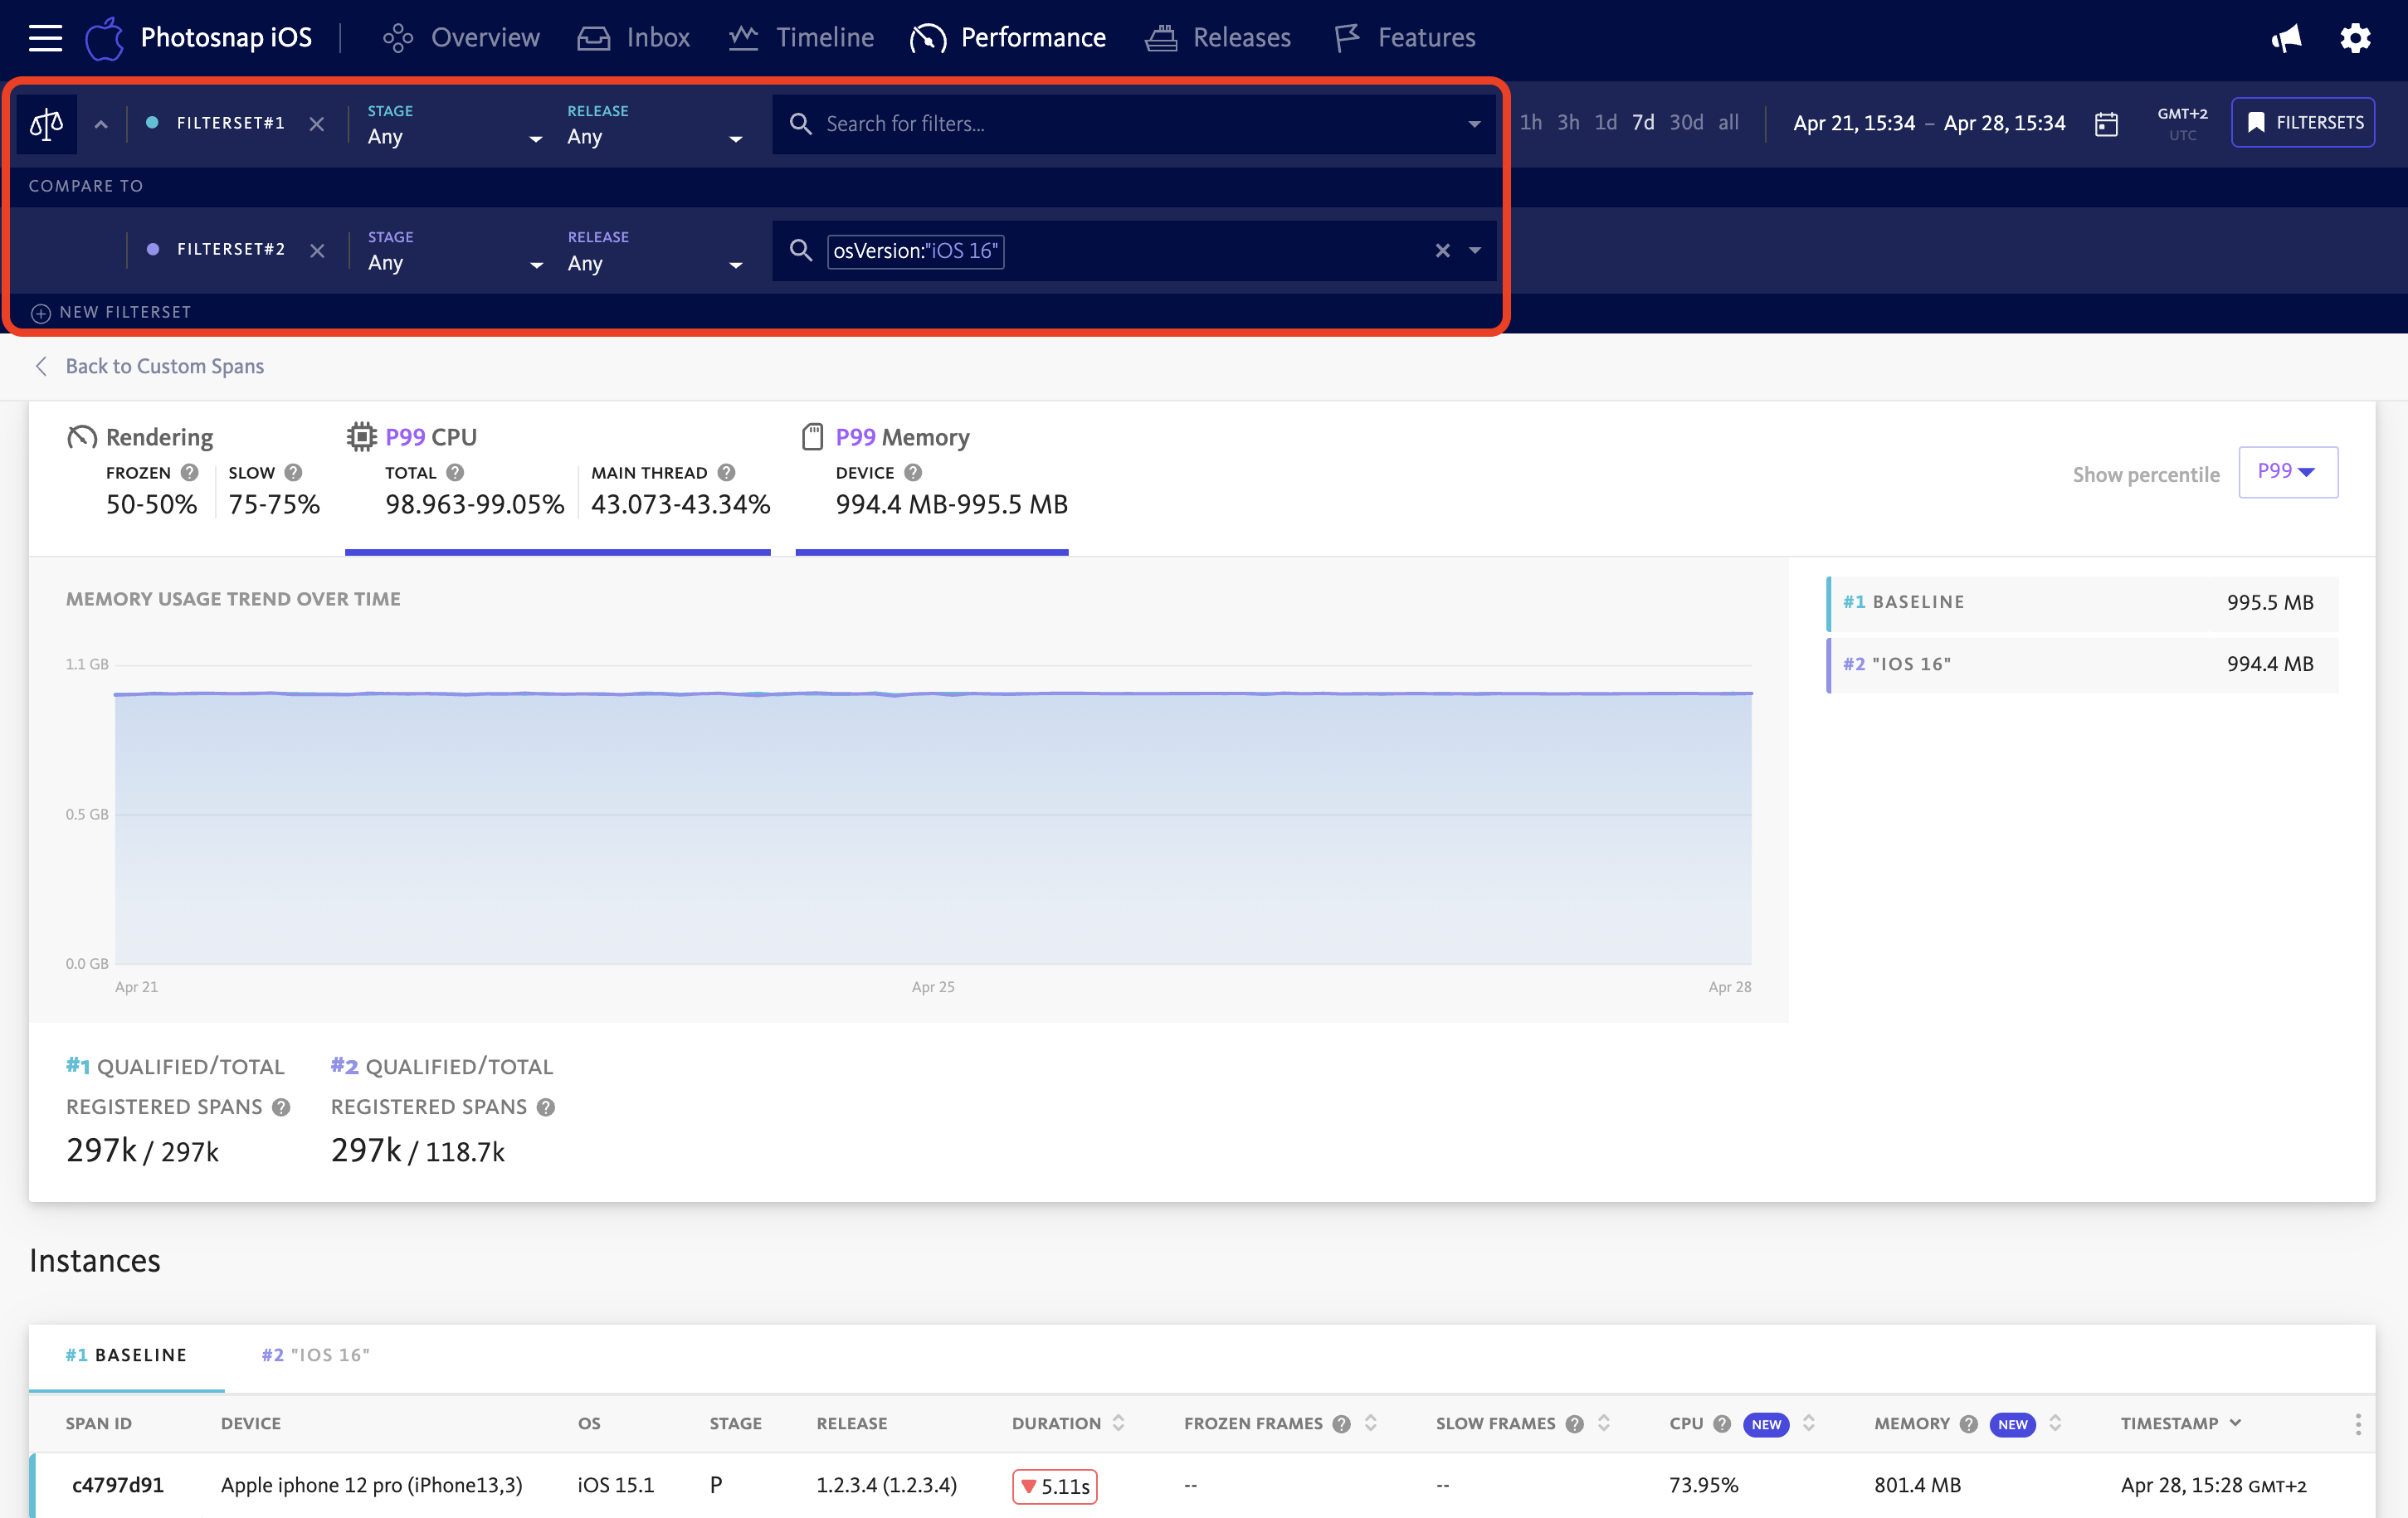
To gain a deeper understanding of the scale and source of memory-related issues, BugSnag provides a powerful comparison mode that takes advantage of Custom Filters.

This feature enables analysis of memory consumption across different dimensions such as:
- App stages
- App releases
- Device models
- Operating system versions
By comparing memory usage across multiple app stages or releases, you can easily detect regressions introduced in recent updates. This is especially valuable when analyzing memory footprints of newly added features or optimizations intended to reduce usage.
Similarly, breaking down the data by device model or OS version can help uncover platform-specific issues. For instance, increased memory usage on a particular Android device running an older OS might indicate a compatibility problem or unoptimized code path.