Unity integration guide
Add BugSnag to your Unity games and applications for iOS, Android, macOS, Windows and WebGL.
After completing this guide, exceptions and crashes from supported platforms are automatically detected and sent to BugSnag.
New to BugSnag? Create an account
Looking for performance monitoring? See our performance guide
This documentation is for version 6+ of the BugSnag Unity notifier. If you are using older versions, we recommend upgrading to the latest release using our Upgrade guide. Documentation for the previous release can be found on our legacy pages.
Installation
UPM
If you are using Unity 2019 or higher, the simplest way to install BugSnag is through the Unity Package Manager.
Go to Window → Package Manager and add the package from the following git URL:
https://github.com/bugsnag/bugsnag-unity-upm.git
This will fetch the latest release available when the URL is added. To get a newer version in future builds, re-add the package. You can also specify an exact version using the git tag for the release after the URL:
https://github.com/bugsnag/bugsnag-unity-upm.git#v8.9.1
The latest available version of bugsnag-unity-upm is v8.9.1.
OpenUPM
The main release of the BugSnag Unity SDK is also installable via OpenUPM:
openupm add com.bugsnag.unitynotifier
You can find the installation instructions and package information here.
Manual download
You can also download the latest package (v8.9.1) from our GitHub releases page.
Download the Bugsnag.unitypackage file and double-click it to import into your Unity project.
EDM4U Support
If you are using the External Dependency Manager for Unity (EDM4U) to manage Android dependencies, the above installation steps can lead to conflicts between your app dependencies and the external libraries used by BugSnag Unity.
To avoid this, either use the alternative UPM package at https://github.com/bugsnag/bugsnag-unity-upm-edm4u.git or, if you are installing the BugSnag Unity package manually, enable support in the Editor via Window → Bugsnag → Enable EDM4U Support or via the script:
BugsnagEditor.EnableEDM();
Basic configuration
BugSnag will start automatically in your app once you have configured your API key through Window → Bugsnag → Configuration:
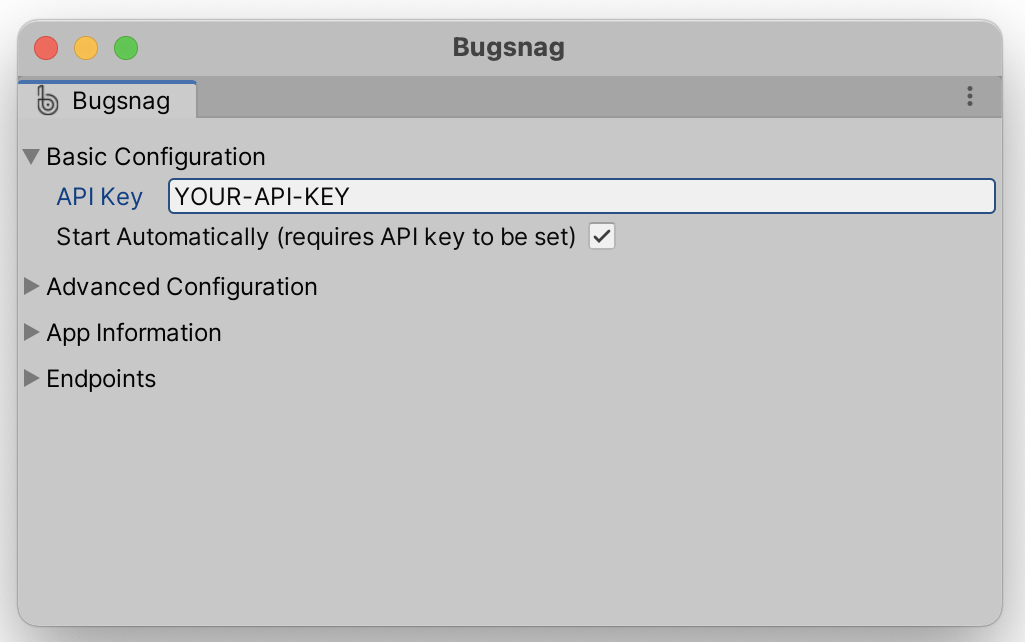
You can find your API key in your project’s settings (shortcut: gs) in the dashboard.
Starting BugSnag manually
If you’d like control over when BugSnag starts, uncheck “Start Automatically” in the Bugsnag Configuration window. Then create a Configuration object by loading the configuration from the Unity Editor, which can then be overridden in code:
var config = BugsnagSettingsObject.LoadConfiguration();
config.AppVersion = "1.2.3-alpha";
Bugsnag.Start(config);
No errors will be captured until BugSnag has been started. It should therefore be initialized as early as possible during your app’s startup to avoid missing any crashes.
Bugsnag.Start must be called from the main thread – e.g. from the Start lifecycle function of a MonoBehaviour.
If you’d like to configure BugSnag further, check out the Configuration options reference.
Showing full stacktraces
For Android or iOS projects in Unity follow the showing full stacktraces guide to upload ProGuard/DexGuard/R8 mappings, NDK symbols, dSYMs and IL2CPP mappings so you can see the original method names, file paths, and line numbers stack traces in both C# and native code.
Reporting unhandled errors
After completing installation and basic configuration, unhandled exceptions will be reported and automatically appear on your BugSnag dashboard.
Unhandled errors that occur outside of your app’s C# code are sent to your BugSnag dashboard when the app next launches. On iOS, they will not be reported when the debugger is attached.
Reporting out-of-memory terminations
On iOS platforms, BugSnag automatically detects terminations of your app caused by the operating system due to high memory usage.
These out-of-memory terminations cannot be detected directly by BugSnag, as the app is killed instantly. We therefore monitor for the app closing unexpectedly, and use heuristics to eliminate other possible causes of the termination (such as system restarts, app updates, and thermal kills).
Because the app is terminated by the OS, these errors do not have an associated stacktrace.
OOM detection is enabled by default as part of the basic configuration steps.
If you wish to disable it, see the EnabledErrorTypes configuration option.
OOMs are sent to your BugSnag dashboard when the app next launches. OOMs will not be reported when the debugger is attached.
Reporting ANRs and fatal app hangs
When your app fails to respond to interactions in real time it causes user frustration and can lead them to abandon your app altogether.
Android
When the main thread of an Android app is blocked for too long, it appears unresponsive and the Android OS creates an Application Not Responding (ANR) error, presenting the user with a dialog option to force quit the app.
ANR detection is enabled by default as part of the basic configuration steps. If you wish to disable it, see the EnabledErrorTypes configuration option.
ANRs are sent to your BugSnag dashboard when the app next launches. ANRs will not be reported when the debugger is attached.
iOS and macOS
When the main thread of an app is unresponsive for a period of time it will appear to the user as a stutter or freeze and may be terminated by the operating system.
This is often referred to as a “watchdog” termination as described in Apple’s documentation.
Detection of these “fatal” app hangs is enabled by default as part of the basic configuration steps.
If you wish to disable it, see the EnabledErrorTypes configuration option.
By default fatal app hangs are reported when the app is terminated after the main thread has been unresponsive for 2000ms.
You can also report non-fatal app hangs (i.e. hangs that did not result in the app being killed) by configuring a minimum app hang threshold duration. This threshold applies to both fatal and non-fatal app hangs and is used by BugSnag to prepare an app hang event report when it is exceeded; if the app subsequently recovers from the hang, a non-fatal hang is reported otherwise a fatal hang will be reported if the app is terminated.
See the Reporting app hangs guide for more information.
Reporting thermal kills
On iOS platforms, BugSnag detects terminations of your app by the operating system due to the device overheating.
Thermal kill detection is enabled by default as part of the basic configuration steps.
If you wish to disable it, see the EnabledErrorTypes configuration option.
Thermal kill events are sent to your BugSnag dashboard when the app next launches. They will not be reported when the debugger is attached.
Reporting handled errors
If you would like to send non-fatal or handled exceptions to BugSnag, you can pass any Exception object to BugSnag’s Notify method in your Unity scripts:
Bugsnag.Notify(new System.Exception("Non-fatal"));
BugSnag subscribes to the Unity logging framework messages. By default Unity log messages of type Exception will be sent as BugSnag errors.
Debug.LogException(new System.Exception("Non-fatal"));
To configure which log levels will be reported as errors, see the Notify Log Level configuration option.
Adding diagnostics or adjusting severity
It can often be helpful to adjust the severity or attach custom diagnostics to handled exceptions. For more information, see Reporting handled errors.
Sending diagnostic data
Automatically captured diagnostics
BugSnag will automatically capture and attach the following diagnostic data to every exception report:
- Full stack traces for all threads.
- App state including running time and time in foreground.
- Build information including name, version/build and release stage.
- Device specification including model, OS version and total memory.
- System state including orientation, free memory, available disk space and battery level.
For more information see Automatically captured data.
Attaching custom diagnostics
It can often be helpful to attach application-specific diagnostic data to error reports. This can be accomplished by setting a callback which will be invoked before any reports are sent to BugSnag:
var config = BugsnagSettingsObject.LoadConfiguration();
config.AddOnSendError(@event => {
    @event.AddMetadata("account", "name", "Acme Co.");
    @event.AddMetadata("account", "paying_customer", true);

    // Return `false` if you'd like to stop this error being reported
    return true;
});
Bugsnag.Start(config);
For more information, see Customizing error reports.
Identifying users
In order to correlate errors with customer reports, or to see a list of users who experienced each error, it is helpful to capture and display user information. BugSnag includes helpers for attaching an identifier, email address and name to reports that will be searchable in the dashboard.
By default we will generate a unique ID and send this ID along with every error report from an individual device. If you would like to override this identifier you can set the user ID property.
Bugsnag.SetUser("userId", "user@example.com", "User Name");
Logging breadcrumbs
In order to understand what happened in your application before each error, it can be helpful to leave short log statements that we call breadcrumbs. A configurable number of breadcrumbs are attached to each error report to help diagnose what events led to the error.
Automatically captured breadcrumbs
By default, BugSnag captures common events including:
- Unity scene changes
- Low memory warnings, network connectivity changes, and other device metrics on Android and iOS
- Low-severity messages logged using
Debug.Log - Prior non-fatal error events
Capturing UnityWebRequest breadcrumbs
If you use the built-in UnityWebRequest class for network requests in your app, you can use the BugsnagUnityWebRequest wrapper to capture network requests as breadcrumbs in your error reports. For usage instructions, see our Customizing breadcrumbs guide.
Leaving custom breadcrumbs
Leaving breadcrumbs with a short message can be accomplished as follows:
Bugsnag.LeaveBreadcrumb("Player won");
When logging breadcrumbs, we’ll keep track of the timestamp, and show both the message and timestamp on your dashboard.
BugSnag will keep track of the time and order of the breadcrumbs and show them on your dashboard.
Additional data can also be attached to breadcrumbs by providing the optional type and metadata parameters. For more information and examples for how custom breadcrumbs can be integrated, see Customizing breadcrumbs.
Session tracking
The BugSnag SDK tracks the number of “sessions” that happen within your application. This allows you to compare stability scores between releases on your dashboard and helps you to understand the quality of your releases.
Sessions are captured and reported by default. This behavior can be disabled using the AutoTrackSessions configuration option.
BugSnag will automatically report a session each time the app is launched or enters the foreground after being in the background for at least 30 seconds.
For more information about controlling session tracking, see Capturing sessions.
Declaring feature flags and experiments
Monitor errors as you roll out features or run experiments and A/B tests by declaring your feature flag and experiment usage in the BugSnag SDK. You can use the Features dashboard to identify whether these features have introduced errors into your app.
Bugsnag.AddFeatureFlag("Checkout button color", "Blue");
Bugsnag.AddFeatureFlag("New checkout flow");
For more information, see Feature flags & experiments.
Identifying crashes at launch
By default BugSnag will identify crashes that occur whilst your app is launching, allowing you to prioritize fixing high-impact launch crashes.
Additionally you can use BugSnag to detect recurrent launch crashes: allowing you to take evasive action in your app, such as resetting data or turning off application features.
Follow the Identifying crashes at launch guide to configure this functionality.
Next steps
- Explore a demo app
- Get support for your questions and feature requests
- View
bugsnag-unity, the library powering this integration, on GitHub