Expo performance integration guide
Step-by-step instructions for adding performance monitoring to your Expo projects for Android and iOS.
The BugSnag Performance Expo integration can instrument your app’s start time – within the JavaScript engine – and the network requests it makes. You can also instrument your app to record navigation events and other arbitrary operations in your code.
New to BugSnag? Create an account
Looking for error monitoring? See our integration guide
Installation
Install the @bugsnag/expo-performance package and required peer dependencies using expo install:
expo install @bugsnag/expo-performance expo-constants @react-native-community/netinfo
The latest available version of @bugsnag/expo-performance is v54.0.0.
Support for the BugSnag package matches the policy of the Expo SDK: ~6 months of backwards compatibility, spanning approximately 3 major releases. For simplicity, the versioning of our package aligns with the version of the Expo SDK that it supports. A list of supported SDK versions can be found on the “Upgrade Expo SDK” page.
Basic configuration
We recommend putting your API key in app.json or app.config.js and BugSnag will pick it up automatically:
{
  "extra": {
    "bugsnag": {
      "apiKey": "YOUR_API_KEY"
    }
  }
}
This is the same API key used by the BugSnag Error Monitoring library.
You can find your API key in your project’s settings (shortcut: gs) in the dashboard.
Then import and start the BugsnagPerformance client as early as possible, just before your App or root layout component are initialized:
import BugsnagPerformance from '@bugsnag/expo-performance'
BugsnagPerformance.start()
To specify any additional configuration options, supply an object instead. We recommend you also set your app’s release stage so that performance data can be easily filtered on the BugSnag dashboard:
BugsnagPerformance.start({
  releaseStage: 'testing'
})
See Configuration options for details on the options available.
Instrumenting app starts
BugSnag can detect and report the app’s startup time within the JavaScript engine. This is measured as the time taken from when the BugSnag Performance SDK is imported until the root component completes its first render. These timings are shown under the “App starts” tab in the BugSnag Performance dashboard.
To enable app start instrumentation, wrap your app component as follows:
export default BugsnagPerformance.withInstrumentedAppStarts(App)
Or if you’re using Expo Router, wrap your root layout component:
export default BugsnagPerformance.withInstrumentedAppStarts(RootLayout)
App start types
You can also categorize your app starts to separate different types of launches on your dashboard. For example, you may wish to see app start data for first-time and logged-in users separately on your dashboard.
To set the app start type, use the following code during the app start period:
import { AppStartSpanQuery } from '@bugsnag/react-native-performance'
BugsnagPerformance.getSpanControls(new AppStartSpanQuery())?.setType('logged-in-user');
Instrumenting navigation
By instrumenting the views in your app, the timings for app navigation events can be shown on the BugSnag Performance dashboard.
If you use Expo Router, React Navigation or React Native Navigation in your app, we have an integration that will automatically instrument navigation events. See the Navigation libraries guide for more details.
Alternatively you can instrument navigations manually by calling BugsnagPerformance.startNavigationSpan when a navigation is started and end on the resulting Span when the navigation is complete:
const span = BugsnagPerformance.startNavigationSpan('HomeScreen')

// When the screen has finished rendering:
span.end()
Instrumenting network requests
BugSnag will automatically detect and report XMLHttpRequest (XHR) and fetch network requests made by your app. These timings are shown under the “Network requests” tab in the BugSnag Performance dashboard.
The networkRequestCallback configuration option allows you to control the data sent in these network request spans using a callback.
To disable the capture of these requests, use the autoInstrumentNetworkRequests configuration option:
BugsnagPerformance.start({
  apiKey: 'YOUR_API_KEY',
  autoInstrumentNetworkRequests: false
})
You can instrument network requests manually by calling BugsnagPerformance.startNetworkSpan when a request is started and end on the resulting Span on completion:
const span = BugsnagPerformance.startNetworkSpan(
  { url: 'https://example.com/api', method: 'GET' })

// When the network request has completed:
span.end()
Sending custom spans
To send custom spans to BugSnag for any other operations you wish to measure, use BugsnagPerformance.startSpan to start a span, and call the span’s end method to end the measurement:
const span = BugsnagPerformance.startSpan("login")
await LoginApi.login()
span.end()
You can use the @bugsnag/plugin-named-spans to track open spans and access them by name from different parts of your codebase. See Named span access for details.
The spanOptions parameter allows you to customize some elements of the span’s behavior:
Reporting child-only spans
If a custom span is “first class”, its performance characteristics will be aggregated and shown in the “Custom” tab of the BugSnag dashboard. If the custom span is useful only for adding insight into the performance of its parent (through the waterfall diagram on the span instance page), you should set the isFirstClass span option to false:
BugsnagPerformance.startSpan("always-nested", { isFirstClass: false });
Controlling span hierarchies
When viewing a single instance of a span in the BugSnag dashboard, a waterfall diagram will show you that instance’s children and their children, and so on. This allows you to see in more detail where the time was spent, and aid diagnosing and fixing any problems. When creating your own spans, you can use the options parameter to control their parent-child relationships to produce a meaningfully representative hierarchy in your dashboard. See Maintaining span context for more information.
Start and end time overrides
By default, a span will use the current timestamp as its start time. However, you can use the startTime span option to report spans that have already started by providing your own timestamp. You can also end a span with your own timestamp to provide a retrospective end time.
Note that the values you provide must either be Dates, or numbers relative to performance.now(). The number produced by Date.now() will not have the desired effect.
let taskStartTime = new Date()

// When the task has completed:
let taskEndTime = new Date()

BugsnagPerformance.startSpan("retrospective-span", { startTime: taskStartTime })
  .end(taskEndTime)
Adding custom span attributes
Additional data can be added to spans to help diagnose performance issues. These are sent as span attributes and will be displayed on your Performance dashboard alongside the automatic span data captured by the SDK.
Attributes are added via a span object and are name value pairs where the type can be either a string, integer, double, boolean or an array of one of these types:
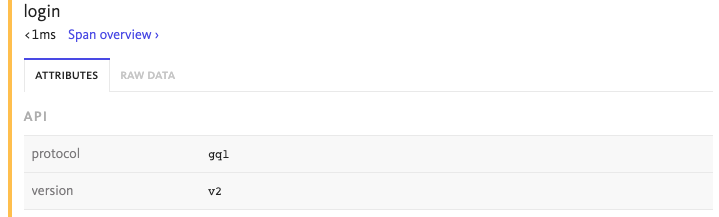
const span = BugsnagPerformance.startSpan('span-with-data')
span.setAttribute('api.protocol', 'gql')
span.setAttribute('api.version', 'v2')
span.end()
You can use a callback to set attributes when they are ending. This allows you to access all spans being generated, including those from automatic instrumentation:
BugsnagPerformance.start({
  apiKey: 'YOUR_API_KEY',
  onSpanEnd: [(span) => {
    span.setAttribute('device.locale', 'en-US ')
    return true
  }]
})
The number and size of attributes added to spans are limited by the SDK to avoid oversized span payloads that would be rejected by the BugSnag API. See the Custom attribute limit configuration options to see how this can be customized if more data is required.
These callbacks can be executed with a high frequency, so care should be taken not to perform complex operations that will have a detrimental effect on performance. For more information, see the span callbacks configuration option.