Kotlin Multiplatform integration guide
Use our Kotlin Multiplatform SDK in your applications for Android, iOS and web.
Installation
Add the bugsnag-kmp dependency to your Module Gradle Settings, usually found at build.gradle.kts:
dependencies {
    implementation("com.bugsnag:bugsnag-kmp:+")
}
iOS
In your Xcode project add bugsnag-cocoa as a Swift Package Manager (recommended) or other project dependency. See our iOS integration guide for instructions.
Basic configuration
We recommend sharing your BugSnag configuration code in a common module and called from the platform-specific initialization code in each of your Kotlin Multiplatform apps:
// BugsnagStartup.kt
import com.bugsnag.kmp.Bugsnag
import com.bugsnag.kmp.Configuration

fun startBugsnag(configuration: Configuration) {
   // common configuration here
   configuration.addMetadata("App", "multiplatform", true)
   Bugsnag.start(configuration)
}
The Bugsnag client should be initialized as early as possible in your application lifecycle. The following are our recommended approaches for Android, iOS and web apps:
Android
Configure your API key in the <application> tag of your App Manifest file (usually in src/main/AndroidManifest.xml):
<application ...>
  <meta-data android:name="com.bugsnag.android.API_KEY"
             android:value="your-api-key-here"/>
</application>
You can find your API key in your project’s settings (shortcut: gs) in the dashboard.
Initialize BugSnag in the onCreate callback of your Application subclass using the common startBugsnag function and the Configuration class from the bugsnag-kmp package:
import com.bugsnag.kmp.Configuration

class MyApp : Application() {
    override fun onCreate() {
        super.onCreate()
        startBugsnag(Configuration(this))
    }
}
Don’t accidentally import com.bugsnag.android.Configuration if you want common configuration
iOS
Configure your API key by adding a Bugsnag Dictionary to your Info.plist file:
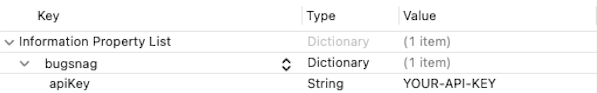
Or in XML:
<key>Bugsnag</key>
<dict>
    <key>apiKey</key>
    <string>YOUR-API-KEY</string>
</dict>
You can find your API key in your project’s settings (shortcut: gs) in the dashboard.
Initialize BugSnag in the didFinishLaunchingWithOptions method of your AppDelegate class, or in the init method of your App class:
@main
struct iOSApp: App {
   init() {
      BugsnagStartupKt.startBugsnag(
        configuration: Bugsnag_kmpConfiguration())
   }
}
Web
Initialize BugSnag as early as possible in your web apps:
startBugsnag(Configuration("your-api-key-here"))
Showing full stacktraces
In order to see the original method names, file paths and line numbers in the stacktraces that are reported on your dashboard, certain symbol and mapping files need to be uploaded for each of your builds.
To upload these files, we recommend using the bugsnag-cli tool. This will attempt to locate and upload the appropriate symbol files for each platform from your Kotlin Multiplatform project and can be added to your CI/CD pipeline:
bugsnag-cli upload android-aab app
bugsnag-cli upload xcode-archive iosApp
bugsnag-cli upload jsApp --api-key=YOUR_API_KEY --base-url="https://example.com/js"
Each CLI command can be customized with configuration options to suit the layout of your project. See the upload reference documentation for each command for more information.
Reporting crashes
After completing installation and basic configuration, crashes will be reported and automatically appear on your BugSnag dashboard.
Reporting handled errors
If you would like to send handled exceptions to BugSnag, you can pass any Throwable object to the Bugsnag.notify method:
Bugsnag.notify(Throwable("Something went wrong"))
Adding diagnostics or adjusting severity
It can often be helpful to adjust the severity or attach custom diagnostics to handled errors. This can be achieved by passing an OnErrorCallback as an argument to notify.
The callback receives an Event object as a parameter which can be used to add or amend the data sent to your BugSnag dashboard. You can also return false from the callback to prevent the event being sent at all:
Bugsnag.notify(exception, { event ->
    // Add extra information
    event.addMetadata("account", "name", "Acme Co.")
    event.addMetadata("account", "paying_customer", true)

    // Increase severity
    event.severity = Severity.ERROR

    // Return `false` if you'd like to stop this error being reported
    true
})
Sending diagnostic data
Automatically captured diagnostics
BugSnag will automatically capture and attach the following diagnostic data to every error report:
- Full stack traces for all threads.
- App state including running time and time in foreground.
- Build information including name, version/build and release stage.
- Device specification including model, OS version and memory information.
- System state including orientation, free memory, available disk space and battery level.
For more information see the native platform guides for Android, iOS and JavaScript.
Attaching custom diagnostics
It can often be helpful to attach application-specific diagnostic data to error reports. This can be accomplished by setting a callback which will be invoked before any reports are sent to BugSnag:
val configuration = Configuration()
configuration.addOnSendError { event ->
    event.addMetadata("account", "name", "Acme Co.")
    event.addMetadata("account", "paying_customer", true)
    return true
}
Identifying users
In order to correlate errors with customer reports, or to see a list of users who experienced each error, it is helpful to capture and display user information. BugSnag includes helpers for attaching an identifier, email address and name to reports that will be searchable in the dashboard.
By default we will generate a unique ID and send this ID along with every error report from an individual device. If you would like to override this identifier you can set the user ID property.
Bugsnag.setUser("3", "bugs.nag@bugsnag.com", "Bugs Nag")
Logging breadcrumbs
In order to understand what happened in your application before each error, it can be helpful to leave short log statements that we call breadcrumbs. A configurable number of breadcrumbs are attached to each error report to help diagnose what events led to the error.
Automatically captured breadcrumbs
By default, BugSnag captures some common events automatically.
For more information see the native platform guides for Android, iOS and JavaScript.
Leaving custom breadcrumbs
You can use the leaveBreadcrumb method to log potentially useful events in your own applications:
Bugsnag.leaveBreadcrumb("User clicked a button")
BugSnag will keep track of the time and order of the breadcrumbs and show them on your dashboard.
Additional data can also be attached to breadcrumbs by providing the optional type and metadata parameters:
val metadata = mapOf(
  "from" to "moka",
  "to" to "french press"
)
Bugsnag.leaveBreadcrumb("Preference updated", metadata, BreadcrumbType.STATE)
Session tracking
The BugSnag SDK tracks the number of “sessions” that happen within your application. This allows you to compare stability scores between releases on your dashboard and helps you to understand the quality of your releases.
BugSnag will automatically report a session each time the app is launched or enters the foreground after being in the background for at least 30 seconds.
If you want control over what is deemed a session, you can switch off automatic session tracking with the autoTrackSessions option, and manage the session lifecycle using startSession, pauseSession and resumeSession on the Bugsnag client.
Bugsnag.startSession()
Declaring feature flags and experiments
Monitor errors as you roll out features or run experiments and A/B tests by declaring your feature flag and experiment usage in the BugSnag SDK. You can use the Features dashboard to identify whether these features have introduced errors into your app.
Bugsnag.addFeatureFlag("Checkout button color", "Blue")
Bugsnag.addFeatureFlag("New checkout flow")
Identifying crashes at launch
By default BugSnag will identify crashes that occur whilst your app is launching, allowing you to prioritize fixing high-impact launch crashes.
Additionally you can use BugSnag to detect recurrent launch crashes: allowing you to take evasive action in your app, such as resetting data or turning off application features.
By default, BugSnag will treat crashes that occur during the first 5 seconds after calling Bugsnag.start() as having occurred during launch. You can modify the launch time period using the launchDurationMillis configuration option.
If the previous run of your app crashed during app launch, Bugsnag.start() will block the calling thread for up to 2 seconds to allow the crash report to be sent before the app continues launching. In cases where a launch crash is persistent, this improves the reliability of crash reporting.
After a launch crash, it may be appropriate to take some actions in your app, such as removing cached data or resetting some persistent state, to make another one less likely to occur.
if (Bugsnag.getLastRunInfo()?.crashedDuringLaunch == true) {
    // Enable "safe mode"
}
Next steps
- Get support for your questions and feature requests.