React integration guide
Add BugSnag to your React projects to automatically capture and report errors in production.
This documentation is for version 6 of the BugSnag JavaScript notifier. We recommend upgrading to the latest release using our Upgrade guide. Documentation for the current release can be found here.
Installation
npm
Install BugSnag and the BugSnag / React integration from the npm registry using npm or yarn:
npm install --save @bugsnag/js @bugsnag/plugin-react
# or
yarn add @bugsnag/js @bugsnag/plugin-react
Basic configuration
Depending on which module system you are using, you’ll need to include BugSnag in one of the following ways:
// ES module-style import
import bugsnag from '@bugsnag/js'
import bugsnagReact from '@bugsnag/plugin-react'

// commonjs/node-style require
var bugsnag = require('@bugsnag/js')
var bugsnagReact = require('@bugsnag/plugin-react')
The simplest way to configure the client is to provide your API key as a string:
var bugsnagClient = bugsnag('YOUR_API_KEY')
To specify any additional configuration options, supply an object instead:
var bugsnagClient = bugsnag({
  apiKey: 'YOUR_API_KEY',
  otherOptions: value
})
For information on values that can be set in the configuration object, see configuration options.
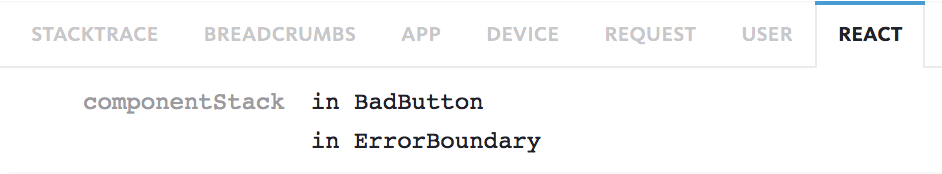
Use the provided error boundary to wrap your application (requires React 16+). When errors happen, they will be reported to BugSnag along with any React-specific info that was available at the time.
Add the React plugin to BugSnag, and pass in the React instance:
bugsnagClient.use(bugsnagReact, React)
And wrap your component tree in it:
var ErrorBoundary = bugsnagClient.getPlugin('react')

// wrap your entire app tree in the ErrorBoundary component
ReactDOM.render(
  <ErrorBoundary>
    <YourApp />
  </ErrorBoundary>,
  document.getElementById('app')
)
In the dashboard, you’ll see errors reported with extra debugging info in a “React” tab. For example:
Customizing the error boundary
The <ErrorBoundary /> component accepts some additional props:
beforeSend– this allows you to pass in abeforeSendcallbackFallbackComponent– by default the error boundary will attempt to re-render the child tree which may result in nothing being rendered at all. If you specify a<FallbackComponent/>, when an error happens BugSnag will render this instead. This means you can display a user-friendly error state.
TypeScript support
Type definitions provided and will be picked up automatically by the TypeScript compiler when you import any of the top-level @bugsnag/* packages.
Reporting unhandled errors
After completing installation and basic configuration, unhandled exceptions and unhandled promise rejections will be automatically reported.
Unhandled errors in React components will be reported along with the component stack.
Reporting handled errors
Sometimes it is useful to manually notify BugSnag of a problem. To do this, call bugsnagClient.notify() with an Error object. For example:
try {
  something.risky()
} catch (e) {
  bugsnagClient.notify(e)
}
See reporting handled errors for more information.
Sending diagnostic data
Automatically captured diagnostics
BugSnag will automatically capture the following data for every exception:
- The current URL
- Script content (if the error originated in an inline
<script/>tag) - Browser name, version, user agent, locale and time
- Operating system
- Release stage (production, beta, staging, etc)
Custom diagnostics
Error reports have a metaData property where arbitrary data can be attached.
Top-level properties of metaData will render as tabs in the BugSnag dashboard. Custom metaData can be supplied globally:
bugsnagClient.metaData = {
  company: {
    name: "Acme Co.",
    country: "uk"
  }
}
For additional options on attaching custom metaData, see customizing error reports.
Leaving breadcrumbs
Breadcrumbs allow you to see a log of actions that led up to an error. Error reports automatically include breadcrumbs for the last 20 events which occurred.
Automatically captured breadcrumbs
By default, BugSnag captures the following events as breadcrumbs.
- Clicks
- Errors
- Console logs, warnings, and errors
- Page load, hide, and show
- DOMContentLoaded events
- Pop state
- History push state and replace state
- Hash change
- HTTP requests
For more information or to disable particular classes of automatic breadcrumb generation see configuration options.
Attaching custom breadcrumbs
You can can use the leaveBreadcrumb(message, metadata) method to log potentially useful events in your own applications:
bugsnagClient.leaveBreadcrumb('User clicked a button')
The time and order of breadcrumbs will be recorded and shown in the dashboard.
The metadata argument is optional and can be used to attach to additional information to a breadcrumb. This can be a one-level-deep key → value mapping object:
bugsnagClient.leaveBreadcrumb('Order summary requested', {
  amount: 4500,
  currency: 'EUR',
  nItems: 21
})
Identifying users
In order to correlate errors with customer reports, or to see a list of users who experienced each error, it is helpful to capture and display user information on your BugSnag dashboard.
You can provide or modify the user information of an error report by supplying the user option to a notify call, or using a beforeSend callback to modify report.user. For information on doing so, see customizing error reports.
Setting a user on the client
In the browser, or in other environments where your process will only be serving a single user (such as a CLI app in Node.js), you can attach user info directly on the bugsnagClient instance. This will then be sent along with all subsequent errors.
// Attach to the client object
bugsnagClient.user = {
  id: '3',
  name: 'Bugs Nag',
  email: 'bugs.nag@bugsnag.com'
}
Tracking releases
Configure your app version to see the release that each error was introduced in.
bugsnag({ appVersion: '4.10.0' })
Then set up a build tool integration to enable linking to code in your source control provider from the releases dashboard, timeline annotations, and stack traces.
Session tracking
The BugSnag SDK tracks the number of “sessions” that happen within your application. This allows you to compare stability scores between releases on your dashboard and helps you to understand the quality of your releases.
Sessions are captured and reported by default. This behavior can be disabled using the autoCaptureSessions configuration option.
In the browser, BugSnag will automatically report a session each time:
- The page loads
- The URL changes via
history.pushState()orhistory.replaceState()
If you want control over what is deemed a session, you can switch off automatic session tracking with the autoCaptureSessions option, and call bugsnagClient.startSession() when appropriate for your application.
Next steps
- View
@bugsnag/js, the library powering BugSnag for JavaScript, on GitHub - Get support for your questions and feature requests