Performance score
Stability features are available on Preferred and Enterprise plans.
The Performance Score is a simple, standardized metric that helps you understand and communicate your application’s performance health. It complements the existing Stability Score, giving you a complete view of both reliability and speed in one place.
By reducing complex data into a single, easy-to-understand percentage, it shows how well your application meets expectations and makes it easier to:
- Identify performance regressions quickly
- Track performance trends over time
- Compare performance across projects or span categories
- Communicate performance status to your team and stakeholders
By using the Performance Score, teams can make informed decisions about when to focus on performance improvements versus delivering new features.
Performance score calculations
Performance Score operates at two distinct levels to give you comprehensive insights into your application’s performance.
- The project-level Performance Score provides an overall view by averaging scores across all span categories in your project.
- The category-level Performance Scores focus on specific types of operations like app starts, network requests, or view loads.
This dual approach allows you to see both the big picture and drill down into specific areas that may need attention.
Project-Level performance score
The project-level Performance Score is based on all category-level Performance Scores in your project. Each category (like “App Starts” or “Network Requests”) first gets its own individual score, and then they are averaged together to create your overall project score. This approach ensures every type of performance data gets equal representation, regardless of how many spans each category contains.
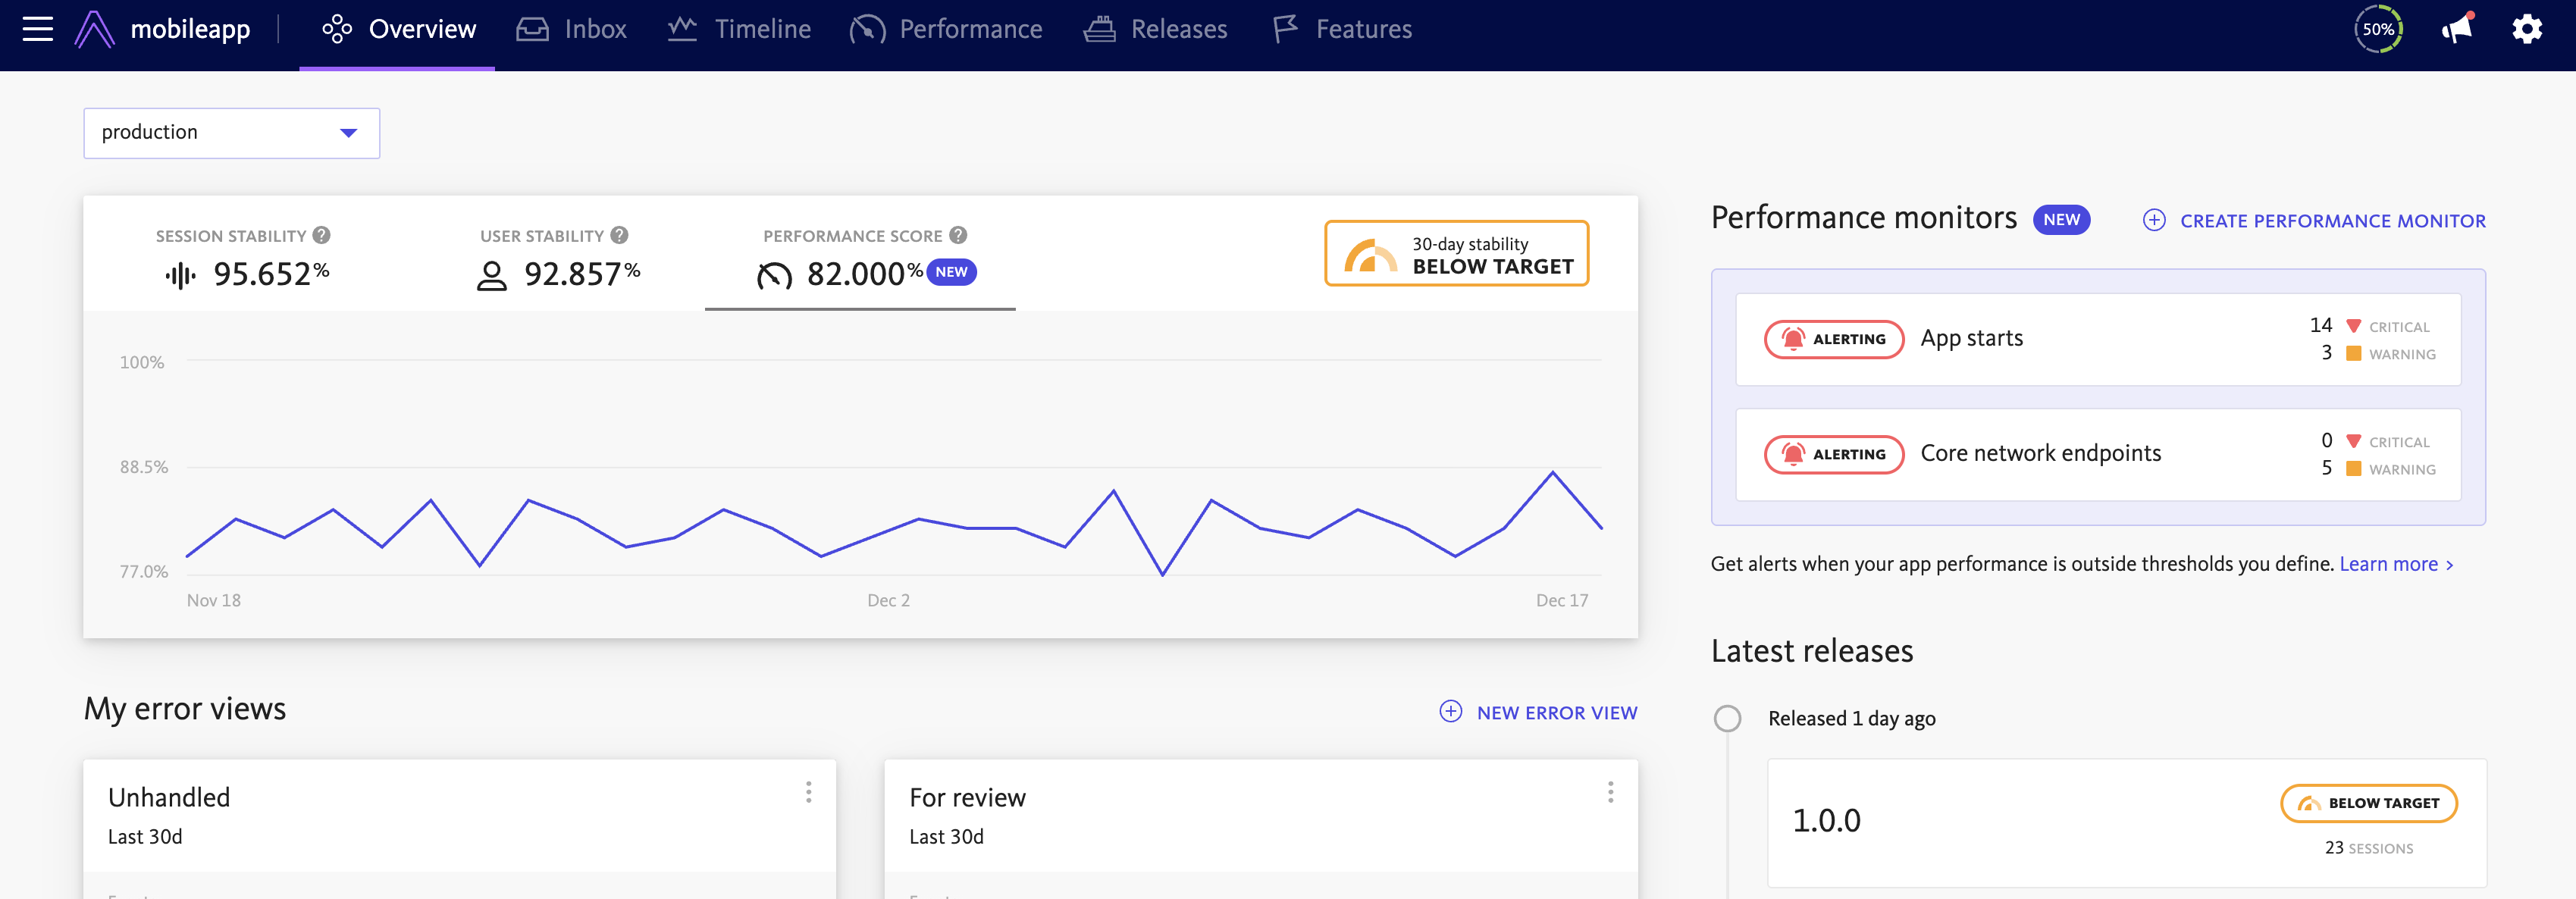
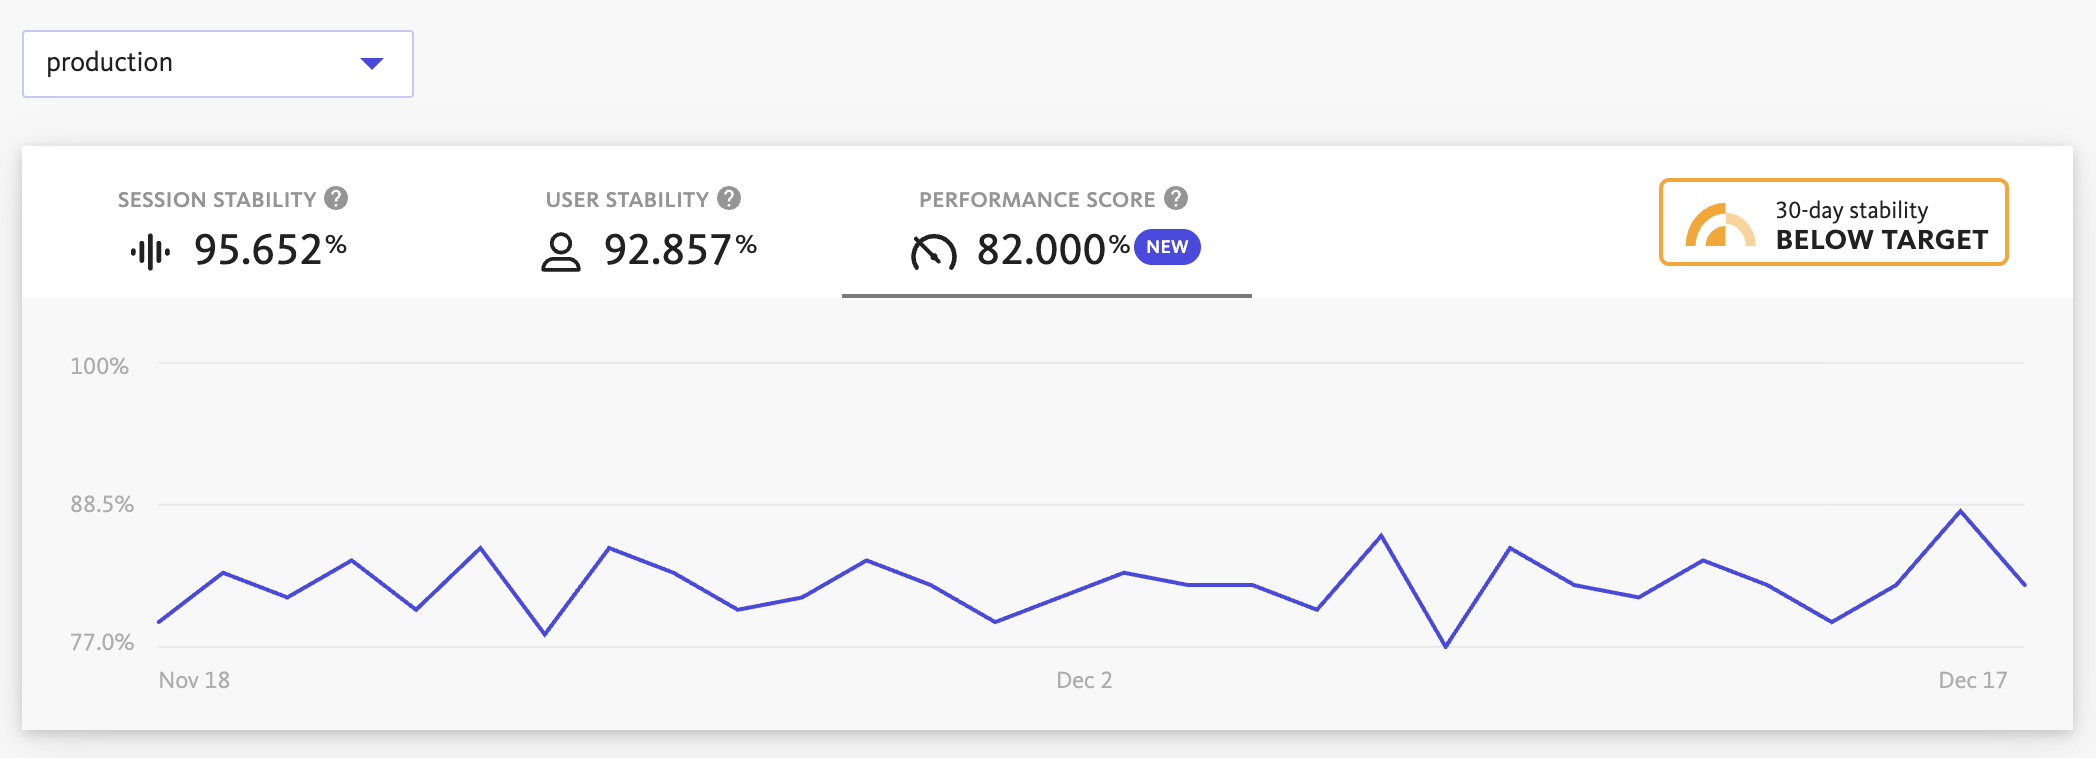
The project-level score is visible in the Stability Center and Project Overview page, displayed next to the existing Stability Score. It provides both the current value and a graph showing the trend over the last 30 days, to show how your application’s performance health is evolving over time.
Category-level performance score
The individual category score is based on Apdex (Application Performance Index), a standard way to measure how satisfied users are with response times. While Apdex usually looks at web requests, our performance score works with many different types of performance data. This includes slow app startup times that can take several seconds; fast view loads that should complete quickly; network requests with variable durations based on payload size; and custom spans with widely different performance expectations.
Each category gets its own score based on all the spans within that category. Spans are grouped into three categories based on their respective Performance Targets:
- Satisfied: Duration ≤ warning performance target
- Tolerating: Duration between warning and critical performance target
- Frustrated: Duration > critical performance target
The Performance Score formula is:
(Satisfied + 0.5 × Tolerating) / Total × 100%
This approach ensures the score reflects thresholds that are meaningful to your team in each of the categories of performance data.
The category-level Performance Score is not accessible in the UI yet but is used to calculate the project-level Performance Score.
Controlling the score calculation
You have control over what data is included in your Performance Score calculation. When performance targets are disabled for a span group, that group is excluded from the Performance Score calculation entirely. This allows you to focus the score on the performance metrics that matter most to your application and business goals.
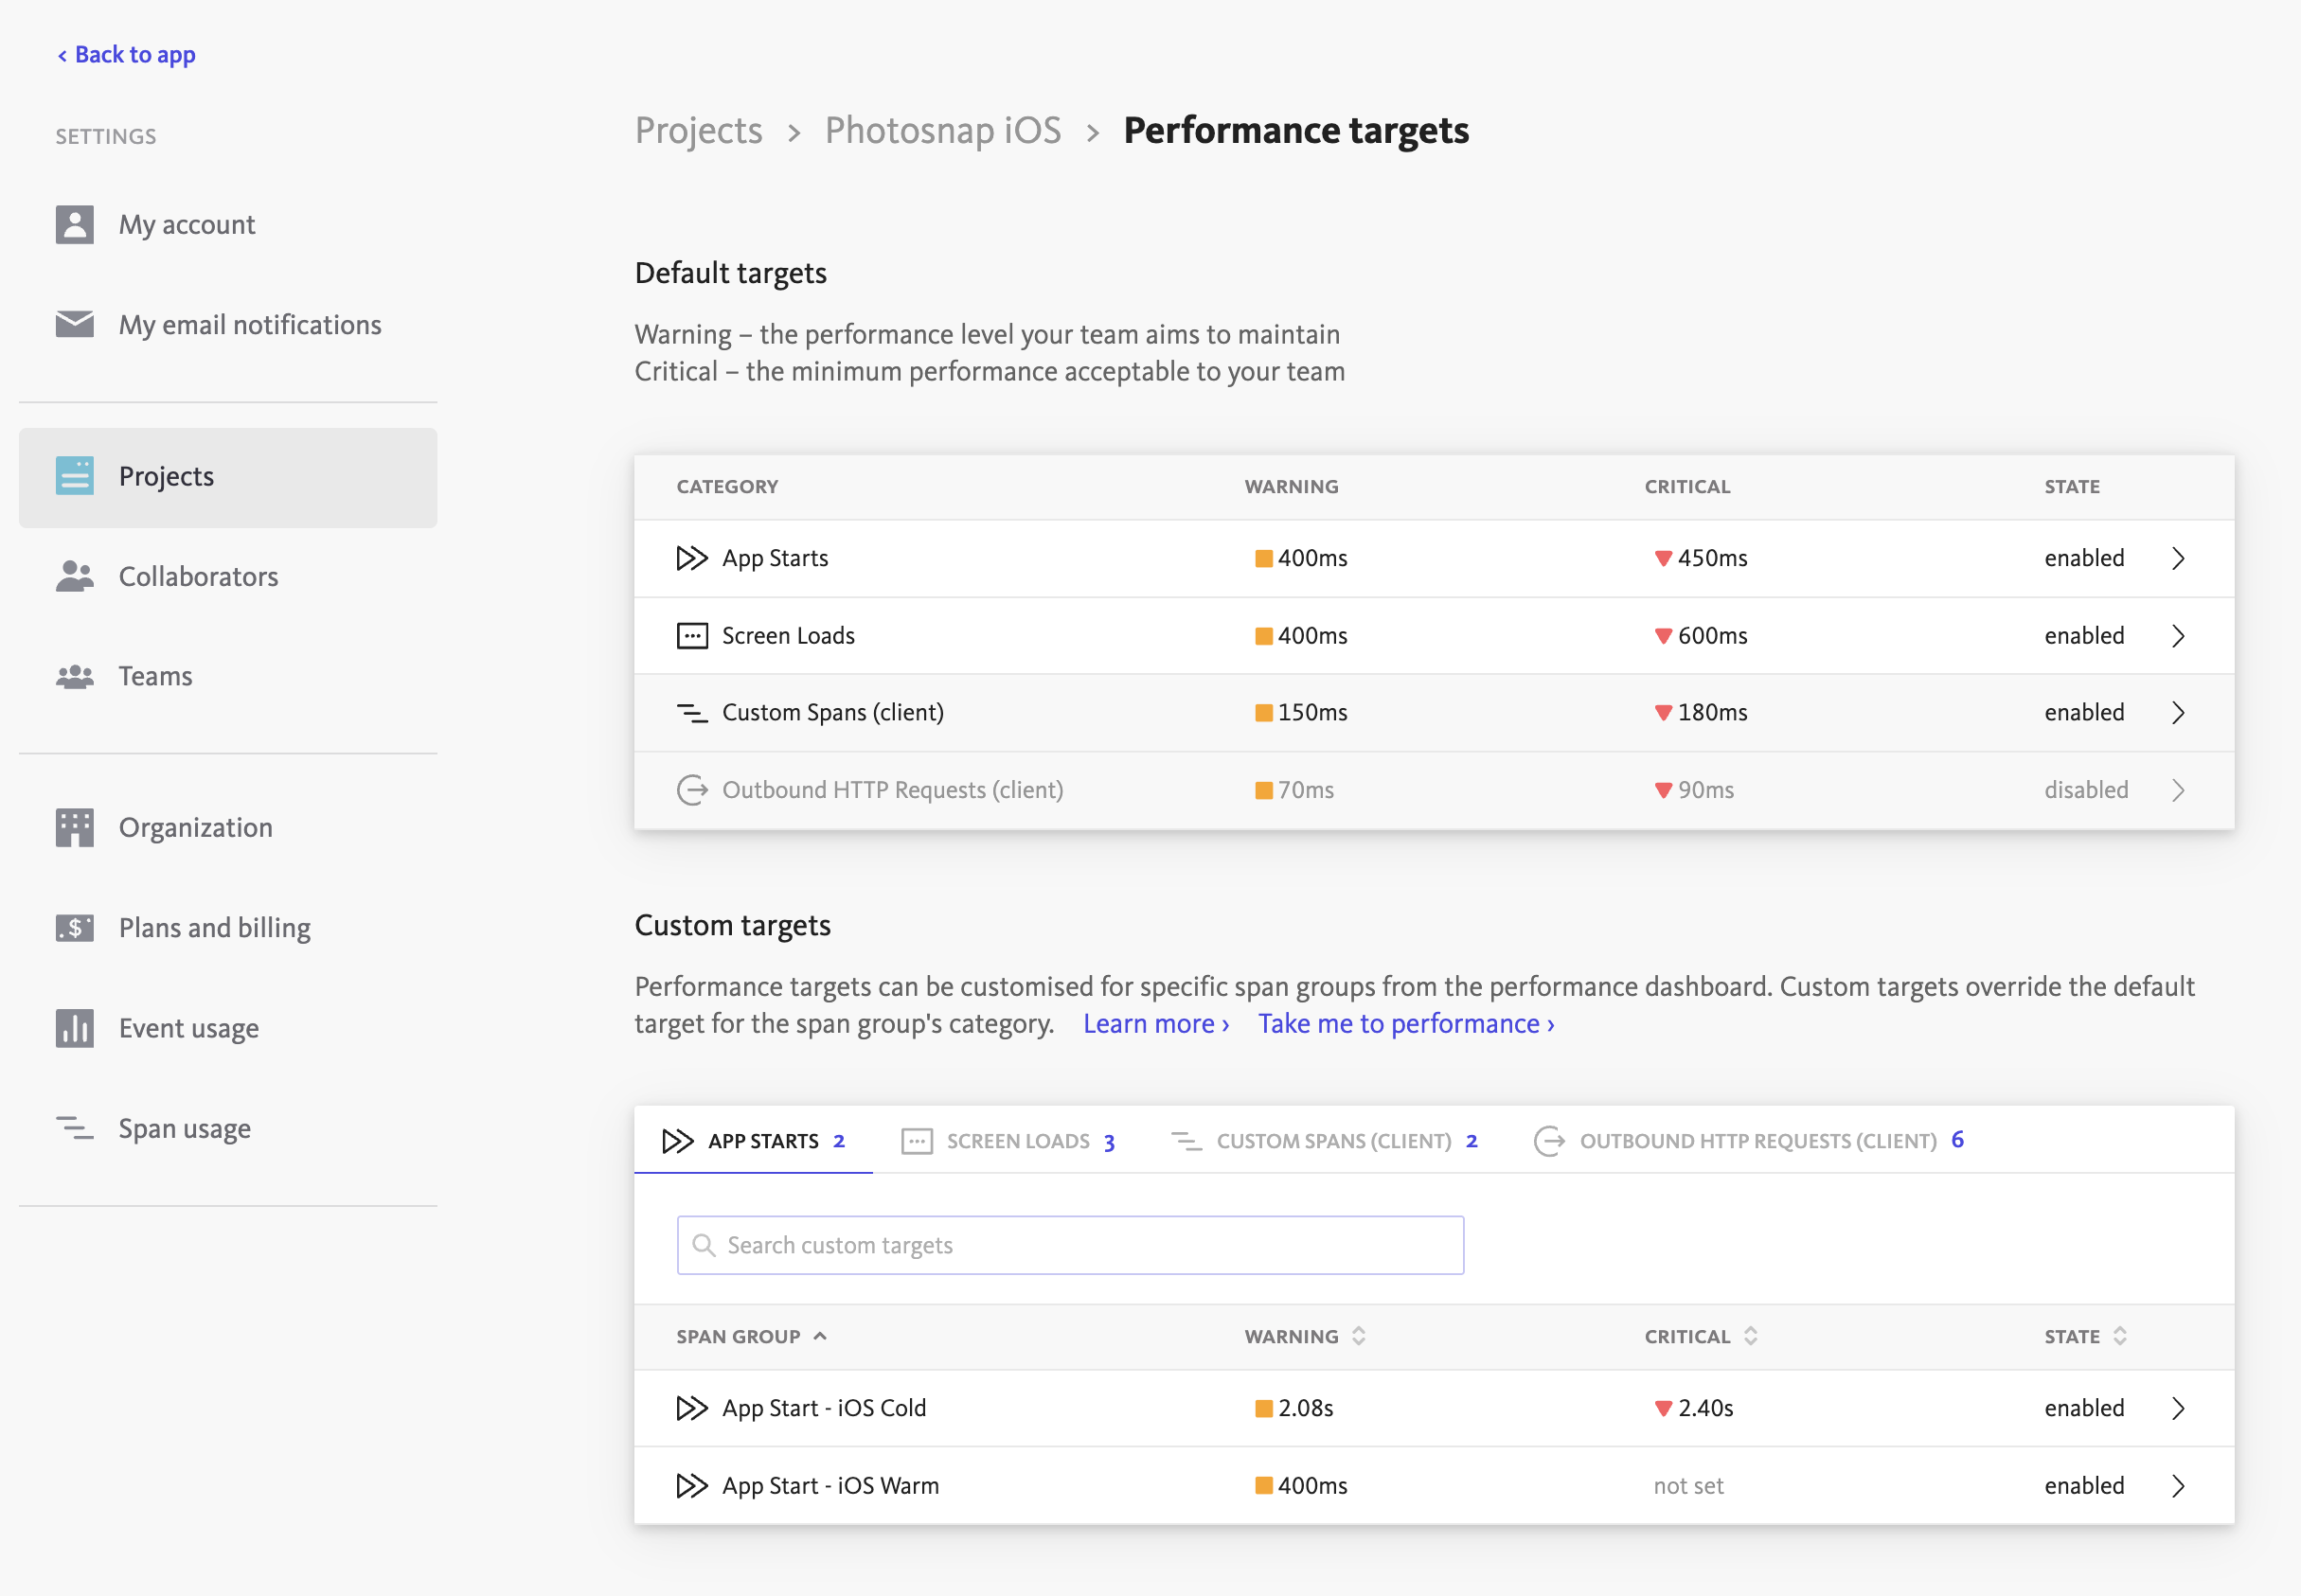
Customize how spans are grouped into Satisfied, Tolerating and Frustrated buckets by setting performance targets for specific span groups or categories. Your custom values will override the default values, ensuring the Performance Score reflects what good and poor performance means for your specific use case.
Default performance target values
If no custom targets are found, the performance score is calculated using predefined default values for each span category:
| Span category | Duration |
|---|---|
| App Startup (iOS) | 400 ms |
| App Startup (Android - Cold) | 5000 ms |
| App Startup (Android - Warm) | 2000 ms |
| App Startup (Android - Hot) | 1500 ms |
| View Load (Mobile) | 200 ms |
| Network Request (Mobile/Browser) | 500 ms |
| Full Page Load (Browser) | 2500 ms |
| Route Change (Browser) | 400 ms |
| Inbound HTTP Request (Server) | 200 ms |
| Inbound gRPC Request (Server) | 100 ms |
| Outbound HTTP Request (Server) | 500 ms |
| Outbound gRPC Request (Server) | 500 ms |