Trace Overview dashboard
Learn how to navigate distributed traces in BugSnag.
Navigation
To navigate to a distributed trace in BugSnag, look out for the View Distributed Trace button when you are reviewing a span instance inside a project in BugSnag:
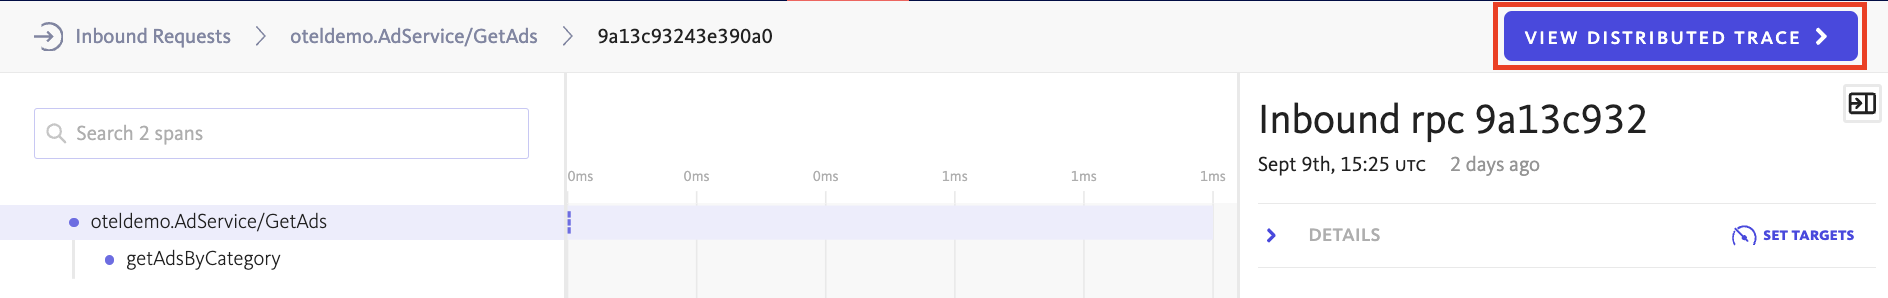
Clicking this button will take you to the Trace Overview page in BugSnag, where you can review a full distributed trace which includes spans from projects across your organization. You will need to ensure you have the appropriate permissions setup to allow you to access the full trace.
Trace Overview page
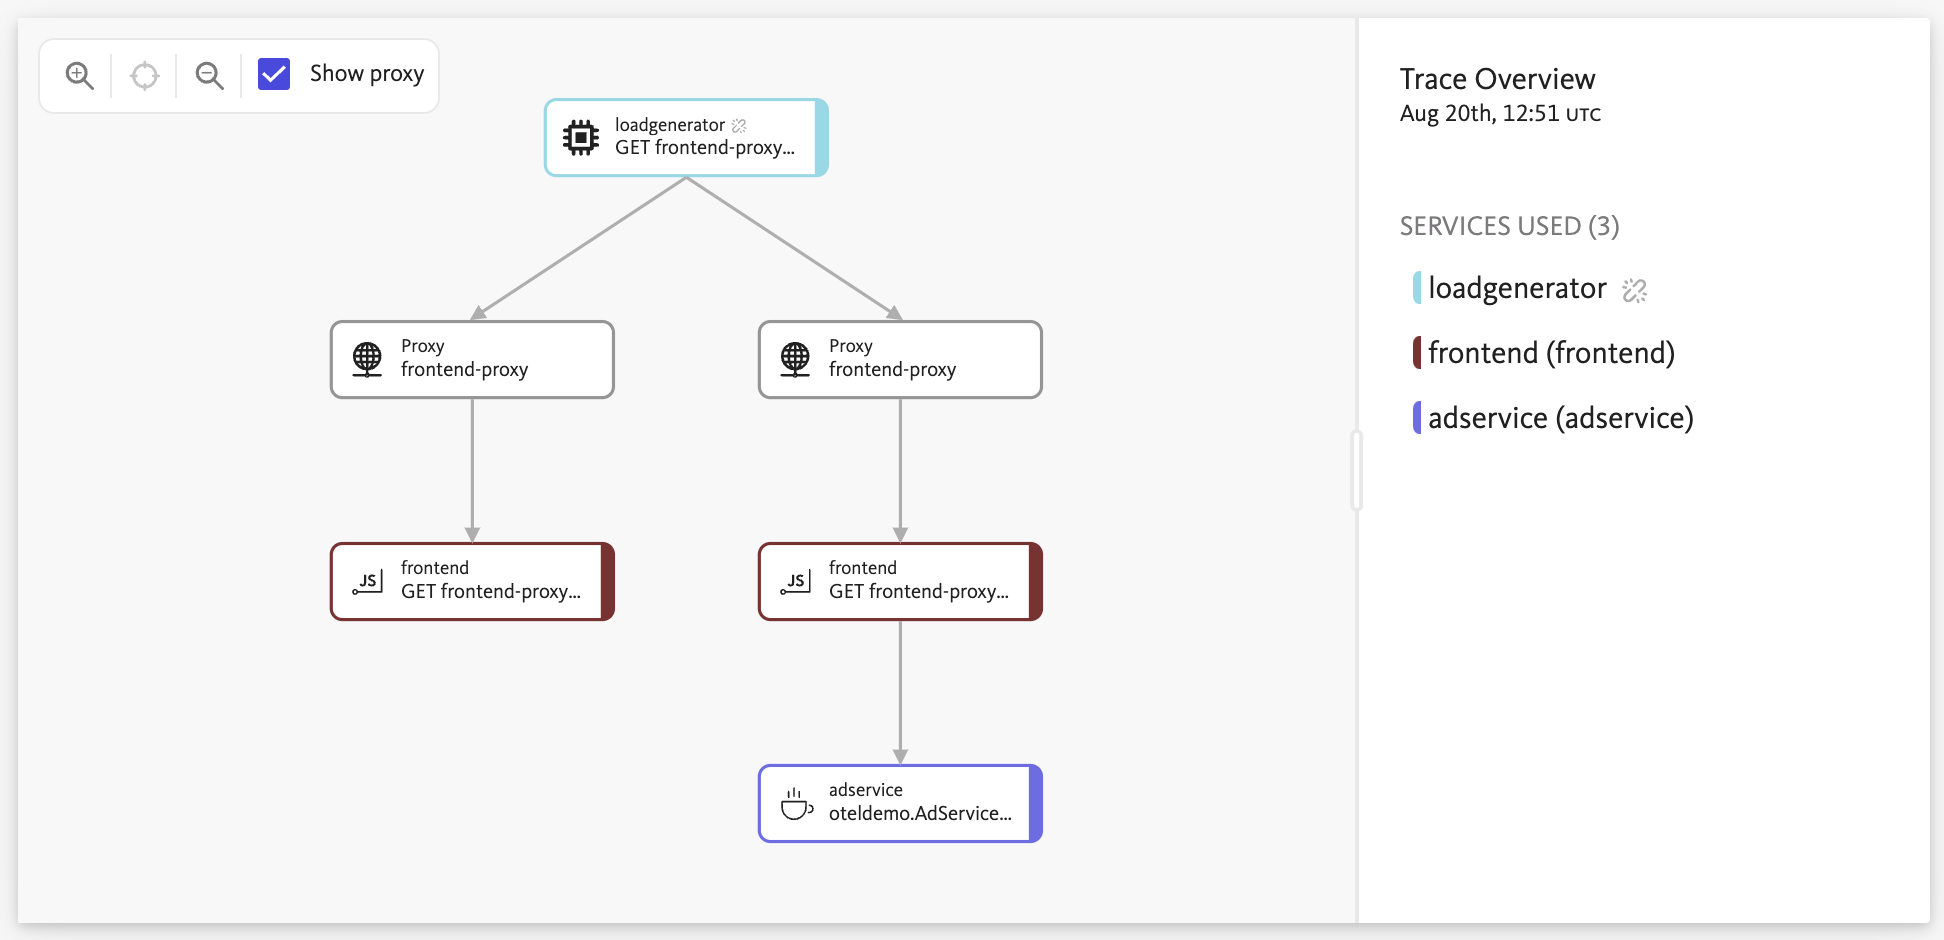
At the top of the Trace Overview page you will see the trace map, which is a tree graph of all the services that were involved in a trace. Each node represents a call made to another service. BugSnag will indicate if multiple calls are made from one service to another – for example your server making multiple database queries – by putting a call count on the branch.
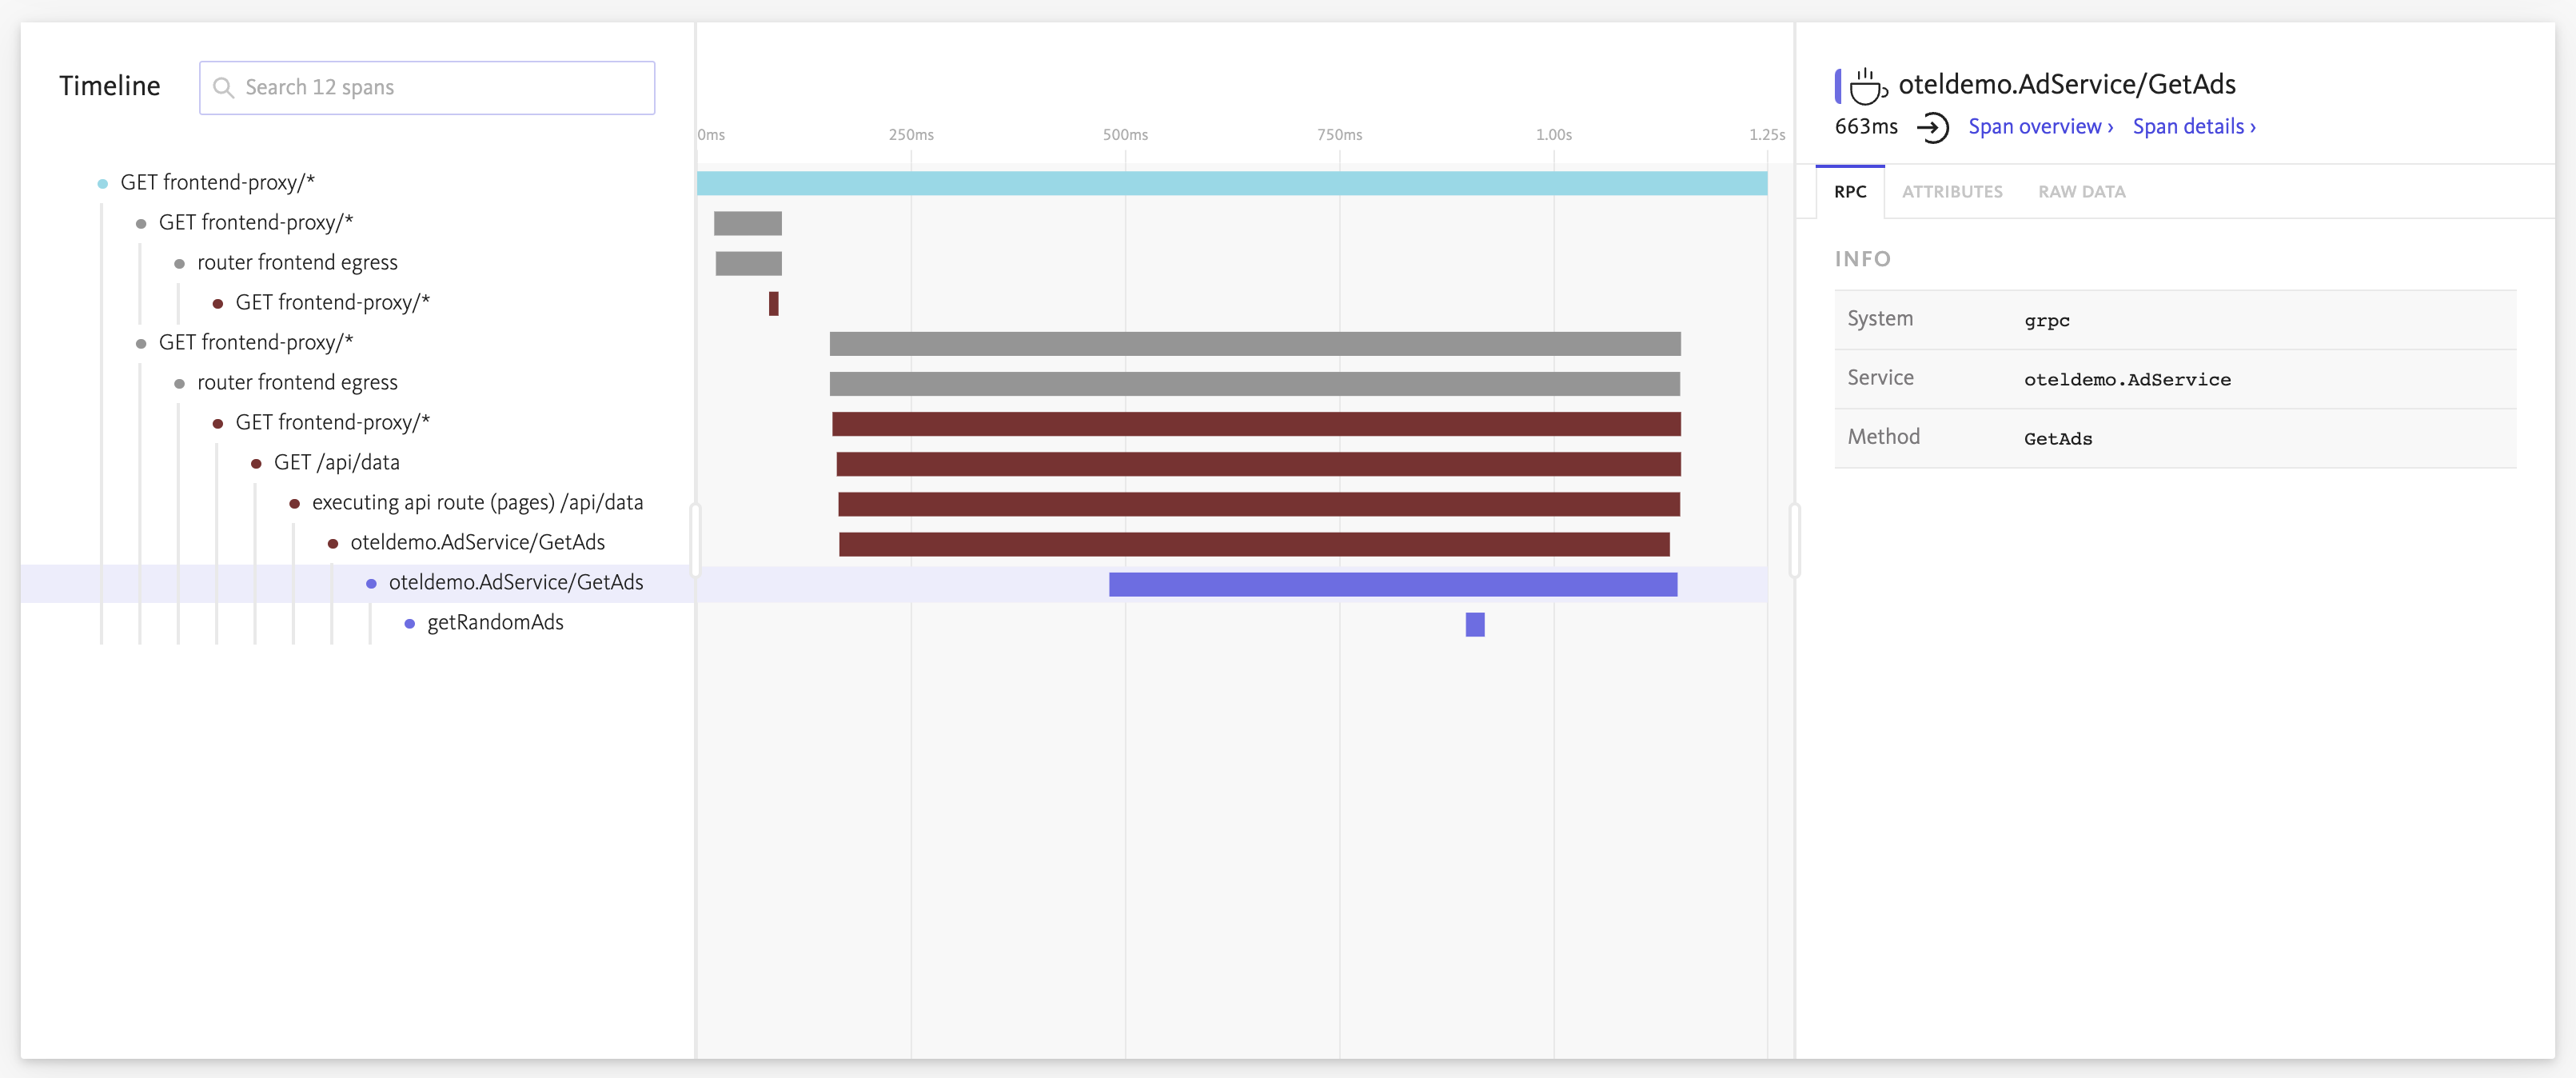
Beneath the trace map is the timeline/waterfall graph, and alongside it the attribute panel. This graph shows you a hierarchical breakdown of the duration for each span in the trace. Clicking any span in the graph will open its attributes panel, showing you the data associated with that span.
Navigating to other projects
From the Trace Overview page, you can navigate to aggregated views of data for any of the projects that make up the trace.
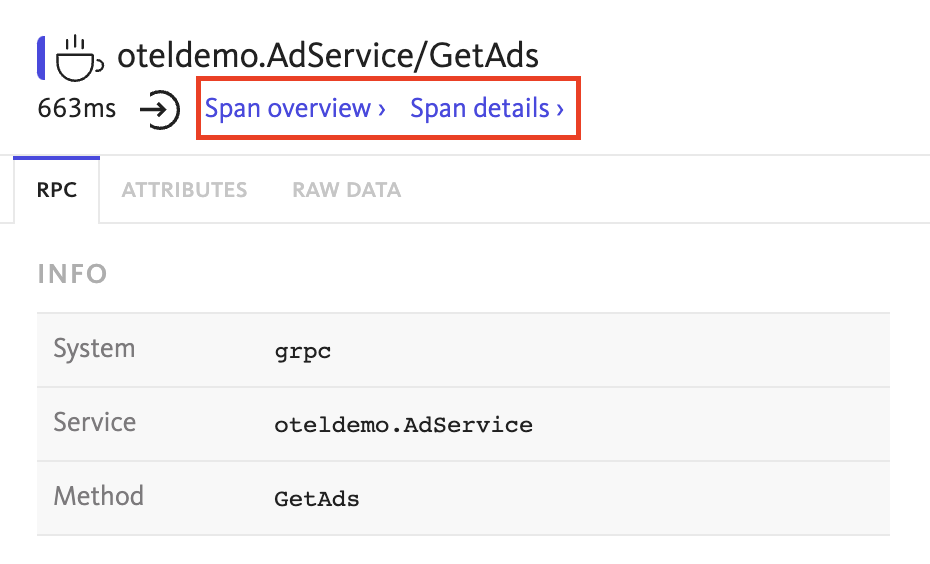
Look out for the Span overview and Span details buttons at the top of the attribute panel, which will take you to the project in BugSnag the selected span belongs to. These buttons only appear when the span is a first class/aggregated span.