Monitoring your instance
Monitor your BugSnag On-premise installation.
This page refers to BugSnag On-premise legacy single machine version 3. For the latest information please see BugSnag On-premise.
BugSnag comes supplied with pre-built Grafana dashboards which you can use to monitor the health of your BugSnag instance and set up alerts.
Starting with Grafana
The Grafana dashboards are available at x.x.x.x:49300. The login details are as follows:
- Username: admin
- Password: available in your Replicated management console (Settings > Service access > Grafana admin password)
Setting up notifications
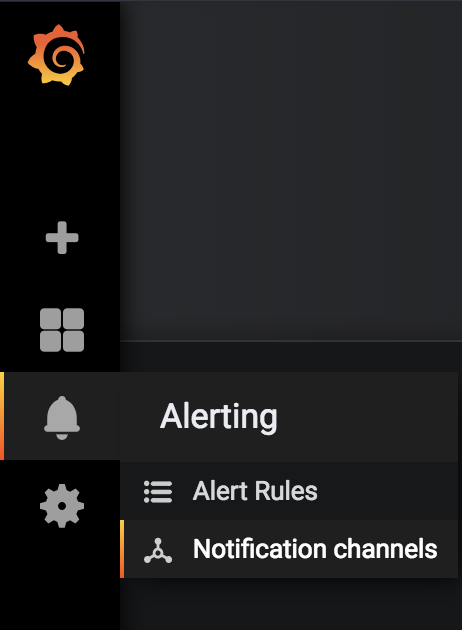
In order to receive notifications when your instance is unhealthy you will need to setup notifications. Select ‘Notification channels’ from the left-hand sidebar under ‘Alerting’.

Here you can setup any notification channels you wish to get alerted on. Please see supported notification types for more information about Grafana’s supported notification channels and how to configure them.
When adding a new notification channel, make sure to select the ‘Send on all alerts’ option.
You can add the email notification channel without entering any credentials as it is configured using the SMTP settings you configured in the Replicated settings.