Sampling of performance data
Learn how BugSnag Performance uses sampling to gather data within your plan limits.
A popular app will generate enormous amounts of performance data. BugSnag Performance uses dynamic sampling to ensure that your users’ devices send the right amount of data for your plan.
Here’s how it works:
- you choose a Performance plan, which buys you a certain number of spans per month across your organization
- each day we allocate a portion of your organization’s quota to each of your projects that are using Performance Monitoring
- based on a prediction of how much data your apps will generate that day, we assign a sampling probability to each project that will meet that project’s daily quota
- the Performance SDKs use that sampling probability to decide which spans to send
- the unit of sampling is the trace, so all the spans in a given trace will be sent
To check your usage over the last 30 days and compare it to your quota, go to “Span usage” in organization settings.
If our prediction leads to you sending more spans than are on your plan you will not be charged for the additional spans.
This sampling functionality for spans is completely different to the functionality that prevents you going over your Errors plan quota, which is why we renamed the Error functionality to “rate-limiting”.
Sampling and statistics
Percentiles
BugSnag Performance aggregates your sampled performance span data and calculates percentiles to present in the dashboard.
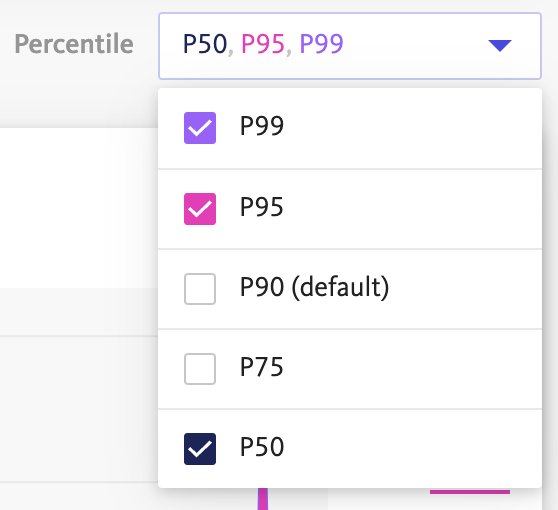
The P90 (90th percentile) duration is reported by default, and P75 for web vitals. A P90 duration represents the duration that 90% of the sampled spans were faster than. The percentile durations displayed are dynamic and update according to the set of filters you have applied in the dashboard. BugSnag allows you to select between the P50, P75, P90, P95 and P99 durations:
Statistical confidence levels
You can have more confidence in the percentiles displayed in BugSnag when you send more data. By sending more data, you reduce the error margin associated with the displayed statistics.
Higher percentiles require you to send more data to BugSnag to reduce error margins and allow you to be confident in the statistics you use for decision making; P99 durations need more data than P50, for example. It is impossible to advise exactly how much data is required, as this will depend on a number of data-specific factors, including the absolute span durations and the shape of your span data distribution (see below for more info). How much data you need to send will also depend on your need for precision; this in turn will depend on external factors such as the business impact of a potential degradation or the baseline that you are comparing a potential change in performance to. If you are willing to accept larger error margins and lower precision/confidence, you can send less data to BugSnag.
By using statistics that have been calculated where there is too little data, you may risk:
- making decisions based on performance statistics that do not represent the actual distribution of data
- missing genuine degradations in performance because they are masked by noise
- misinterpreting spikes to mean there is a genuine issue when in fact it’s just noise
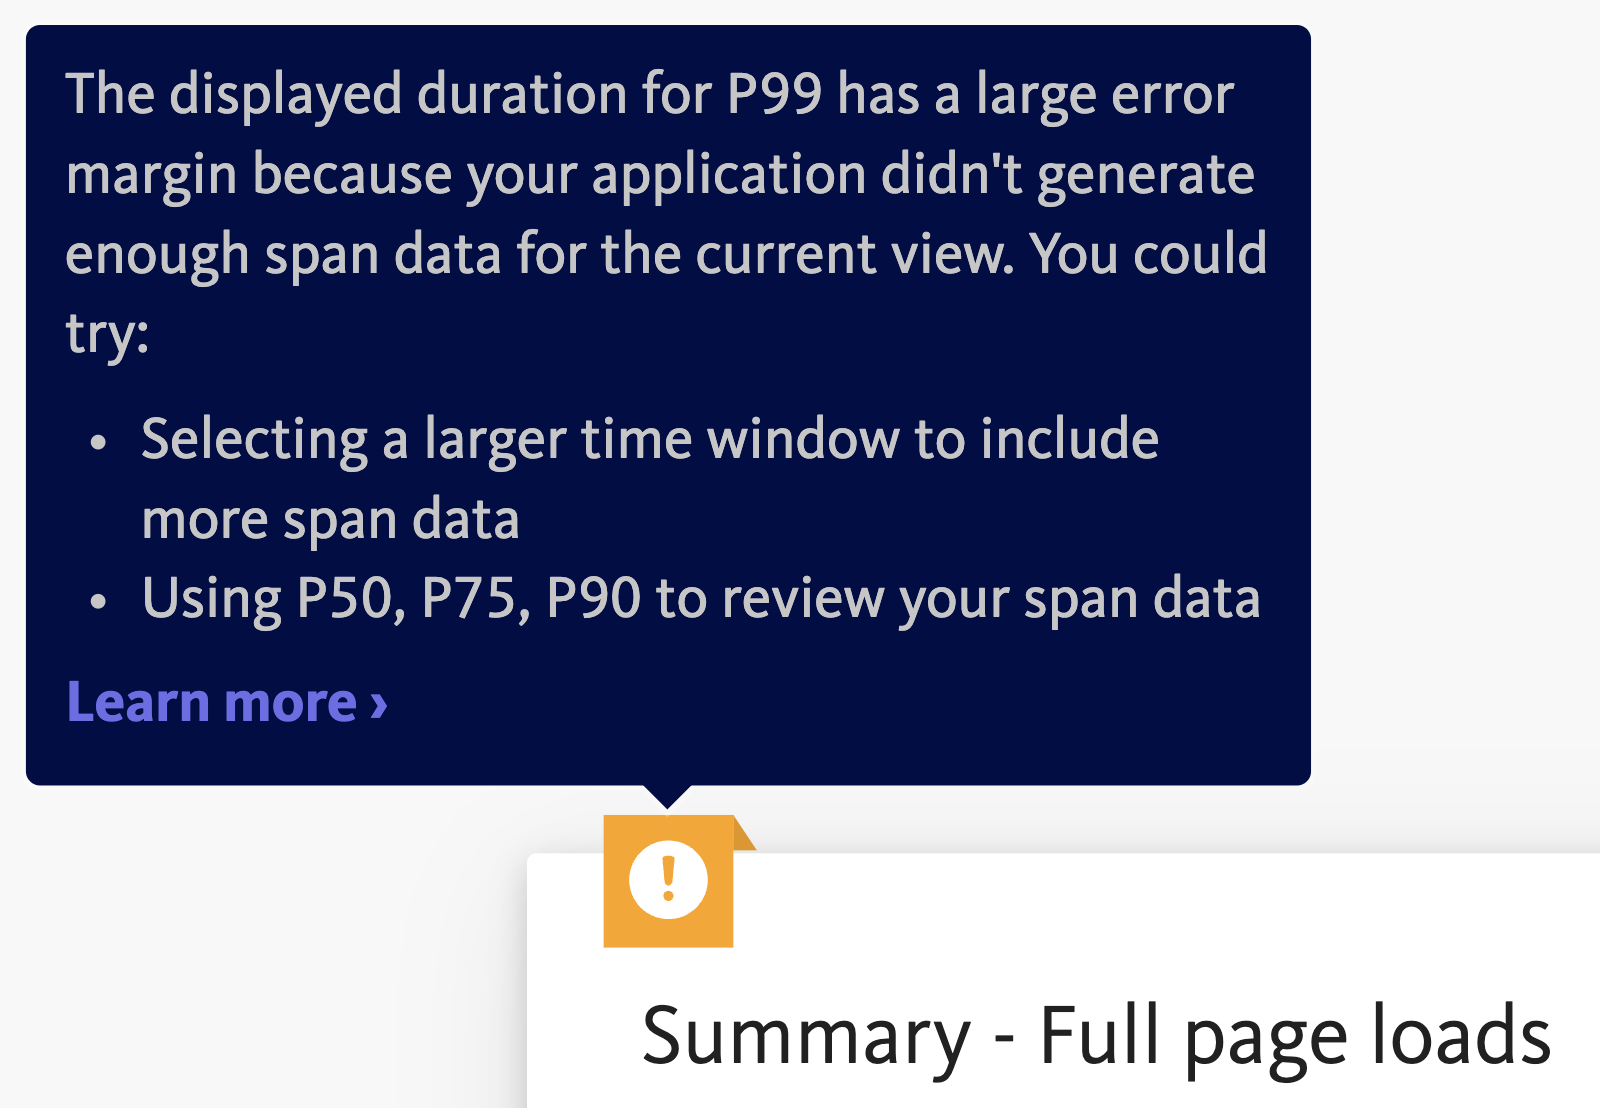
BugSnag Performance will warn you when you are viewing data with a larger error margin, and will make suggestions for what you can do to correct for that. Where we estimate that you are not sampling enough of the spans that your application generates, we will also recommend that you increase your span quota.
For more information, or to help you understand whether you are sending enough performance span data to BugSnag, please contact us.
How much span quota do I need?
There are a number of factors that can influence whether you are generating enough data to be confident in your performance statistics, and ways to fix this.
Low traffic applications may simply not generate enough span data for you to be confident in the statistics. In such scenarios you could consider:
- increasing the time range of filters in BugSnag, for example viewing data over 30 days rather than 7 days
- removing other dashboard filters, for example browser version or app version
- using a lower percentile to investigate performance, e.g. P50
It is often the case that busy applications do not sample enough span data to generate percentiles in BugSnag with sufficiently small error margins that you can be confident in the statistics. This is because as an application becomes more complex your span quota becomes much more diluted; either because your app has many different page/screen loads, or because traces contain more child spans. This means that any given span group (e.g. a particular screen/page load, network request) is less likely to have enough data to have sufficiently small error margins.
While the in-dashboard techniques above can help to reduce the error margins, the best solution is to sample more data by increasing your span quota, giving you as much control as you need to filter your data and use all available percentiles.